Most home service businesses believe slow growth means one thing: “We need more leads.”
So roofing companies, HVAC contractors, plumbers, and other service businesses increase ad spend. They buy more Google Ads. They invest in SEO. They switch marketing agencies.
Yet production stays flat.
Here’s the reality:
Most contractors don’t have a lead generation problem.
They have a territory strategy problem.
Why Home Service Businesses Misdiagnose Growth Problems
Lead generation is easy to measure.
You can see:
- Cost per lead
Conversion rate
Cost per acquisition
Call volume
But those metrics don’t measure market position.
They don’t show:
Who controls market share in a ZIP code
Where permit activity is rising
Which competitor is accelerating
Where real production growth is happening
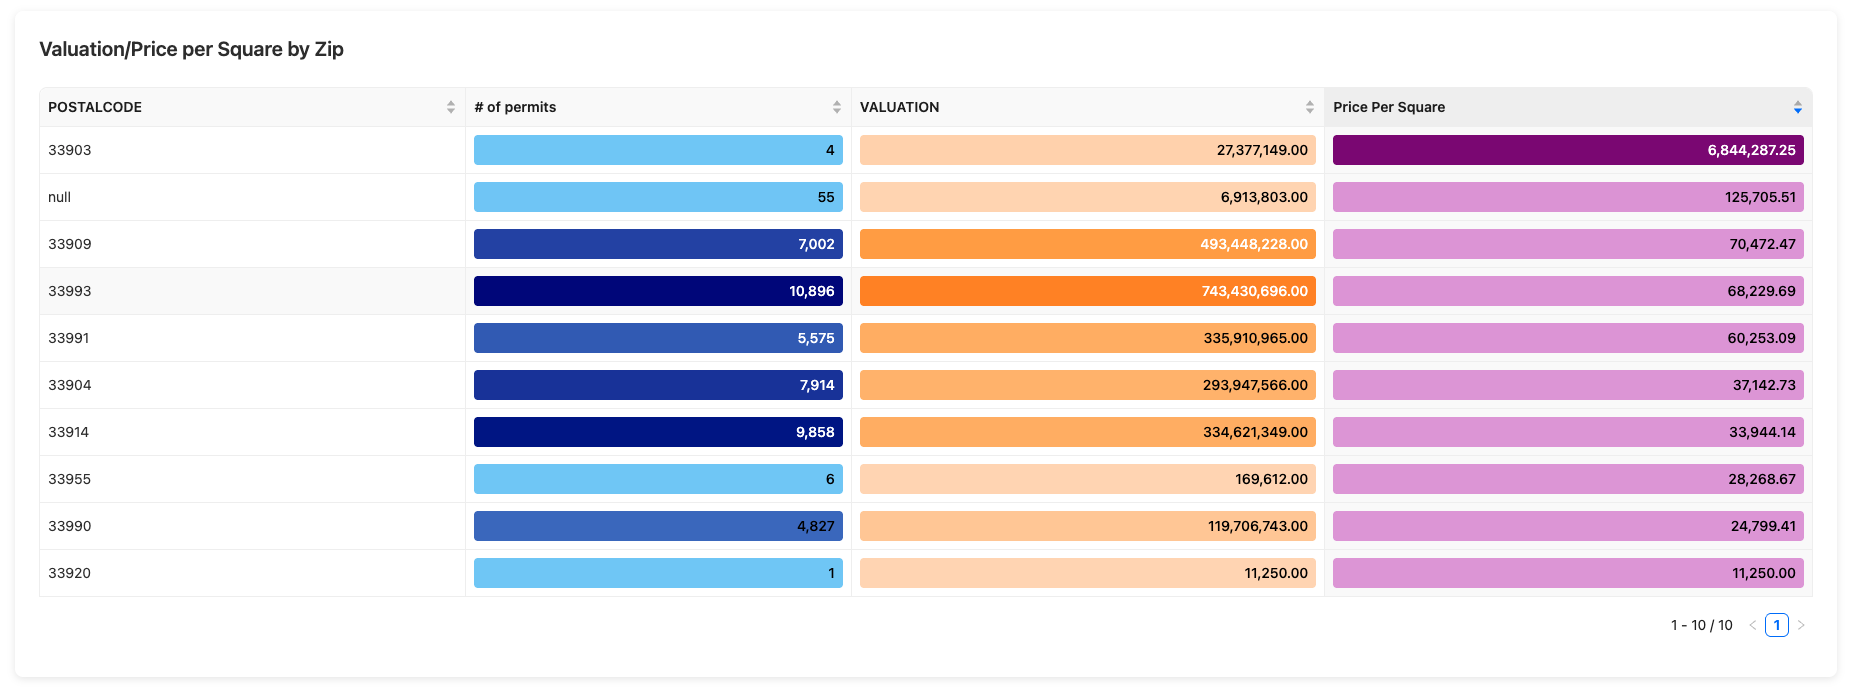
Without understanding service area performance, contractors end up overspending in low-opportunity territories while competitors quietly dominate high-growth areas.
What Permit Data Reveals About Contractor Market Share
Construction permit data is one of the clearest indicators of real demand in local home service markets.
Marketing metrics show interest. Permit data shows closed jobs.
If 200 roofing permits are pulled in a ZIP code over 60 days and your company pulls 15, your roofing market share is 7.5%.
That number tells you far more about your growth potential than cost per click ever could.
Permit data analysis allows contractors to:
Identify high-growth ZIP codes
Track competitor permit velocity
Measure contractor market share
Allocate marketing budget strategically
Forecast production more accurately
This is contractor business intelligence — not guesswork.
The Real Issue: Territory Misalignment
Many contractors choose service areas emotionally instead of strategically.
They say:
“We’ve always worked there.”
“Our sales rep lives there.”
“We’ve done a few good jobs there.”
“That’s where our leads come from.”
But smart territory strategy for contractors is data-driven.
It asks:
Is permit activity rising in this ZIP code?
What percentage of permits are we capturing?
Are competitors gaining share?
Is demand stable or declining?
If a ZIP code sees a 25% spike in roofing permit data over 90 days and you’re capturing less than 10%, that’s not a lead problem.
That’s a positioning problem.
Why Market Share Matters More Than Lead Volume
Revenue can fluctuate. Marketing performance can fluctuate.
But market share reveals your true competitive strength.
When contractors dominate a territory:
Brand visibility compounds
Referral volume increases
Crews operate more efficiently
Drive time decreases
Close rates improve
Production becomes predictable
When contractors scatter across random ZIP codes chasing leads:
Operational costs rise
Oversight weakens
Brand density disappears
Marketing efficiency drops
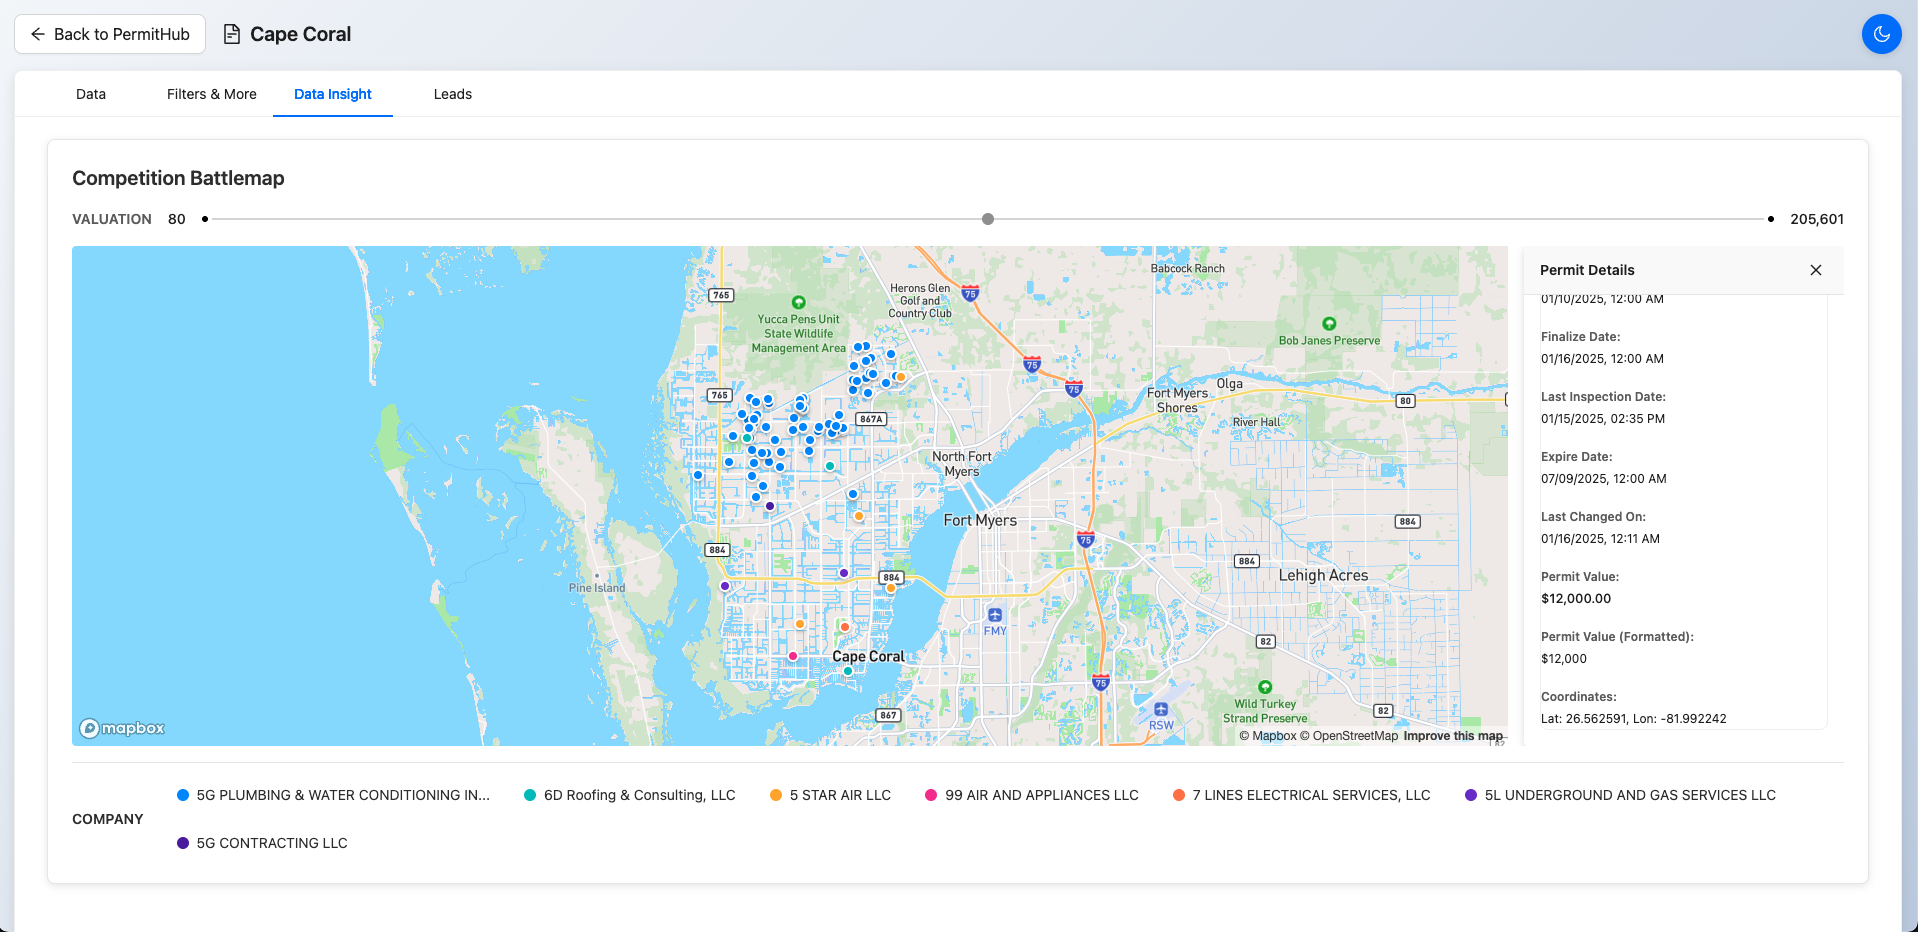
Growth in home services is geographic.
The contractors who understand this build density.
The ones who don’t stay reactive.
How Marketing Agencies Can Use Permit Analytics
For marketing agencies serving roofing, HVAC, or plumbing companies, permit data changes the conversation.
Instead of asking:
“How many leads did we generate?”
You can ask:
“How much market share did we gain?”
Agencies can use permit analytics to:
Target high-growth ZIP codes
Prove ROI through permit volume increases
Identify underserved territories
Detect competitor acceleration early
Build long-term strategy instead of chasing short-term metrics
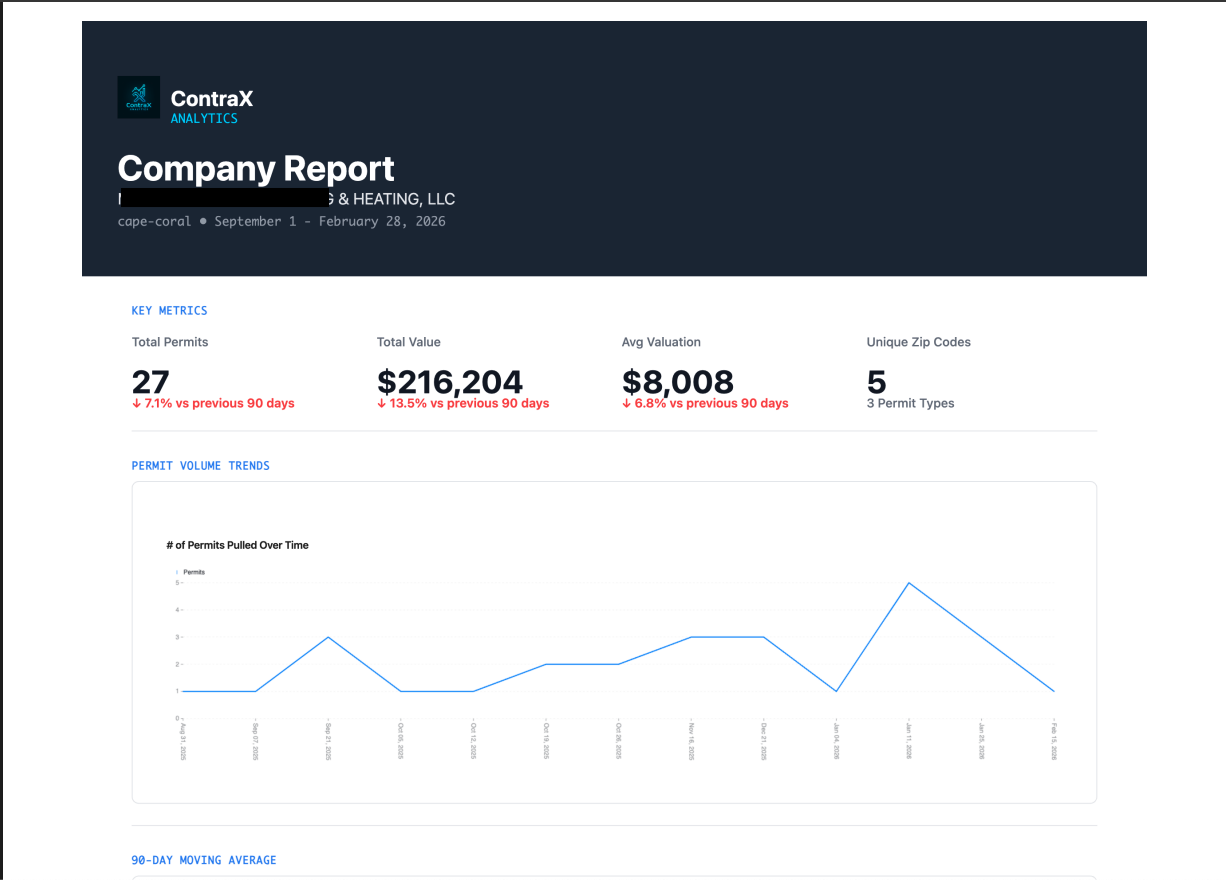
This transforms marketing from tactical to strategic.
Signs Your Home Service Business Has a Territory Problem
You may have a territory strategy issue if:
Marketing spend increases but permit volume stays flat
You cannot define your top-performing ZIP codes
Competitors dominate areas you consider “core”
Permit share fluctuates month to month
You rely heavily on storm events for growth
These are indicators of weak geographic positioning — not weak lead generation.
Using 60- and 90-Day Permit Trends to Forecast Growth
Short-term permit velocity provides predictive insight into your market.
Analyzing rolling 60- and 90-day construction permit data allows contractors to:
Forecast hiring needs
Adjust ad spend by territory
Expand into adjacent ZIP codes strategically
Protect high-performing markets
Anticipate slowdowns before revenue drops
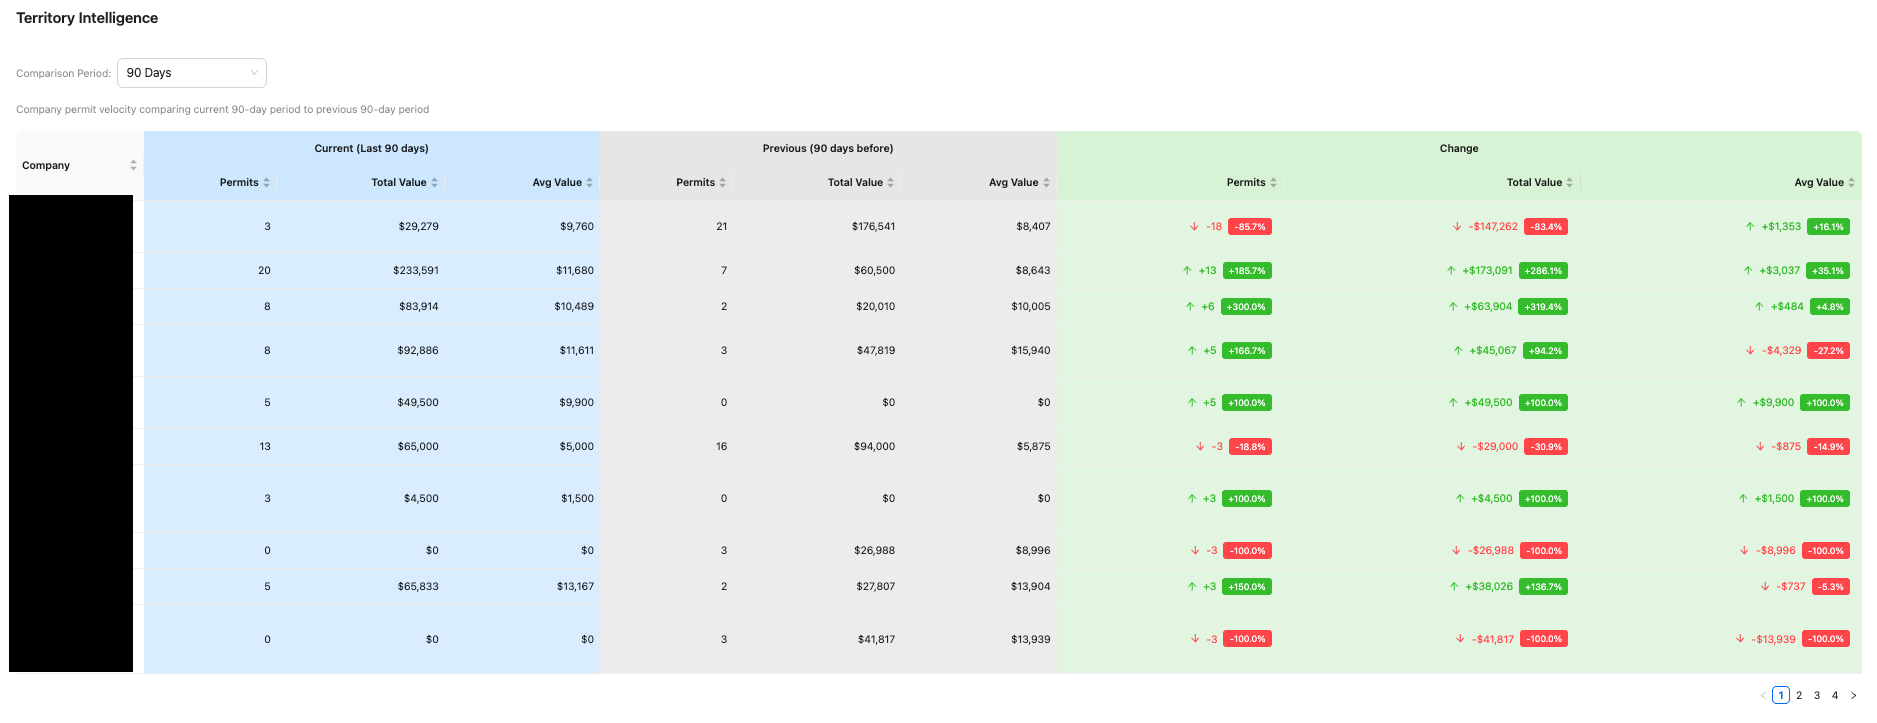
This is how market operators think. They don’t react to slow months.
They anticipate them.
From Lead Buyer to Market Operator
There are two types of contractors:
Lead Buyers
Increase ad spend when nervous
Chase scattered opportunities
Focus on cost per lead
Market Operators
Track contractor market share
Monitor permit data weekly
Protect high-density ZIP codes
Expand strategically
Use territory intelligence to guide growth
The difference isn’t budget.
It’s visibility.
Final Thought: Growth Isn’t Random
If your company feels slow, the first question shouldn’t be:
“How do we get more leads?”
It should be:
“Where is demand increasing — and what percentage of it are we capturing?”
Because home service growth is rarely about volume.
It’s about territory control.
And territory control starts with data.