Find work
Every permit becomes a lead with the property, the contractor, and a score, so your calls go to the addresses most likely to buy.
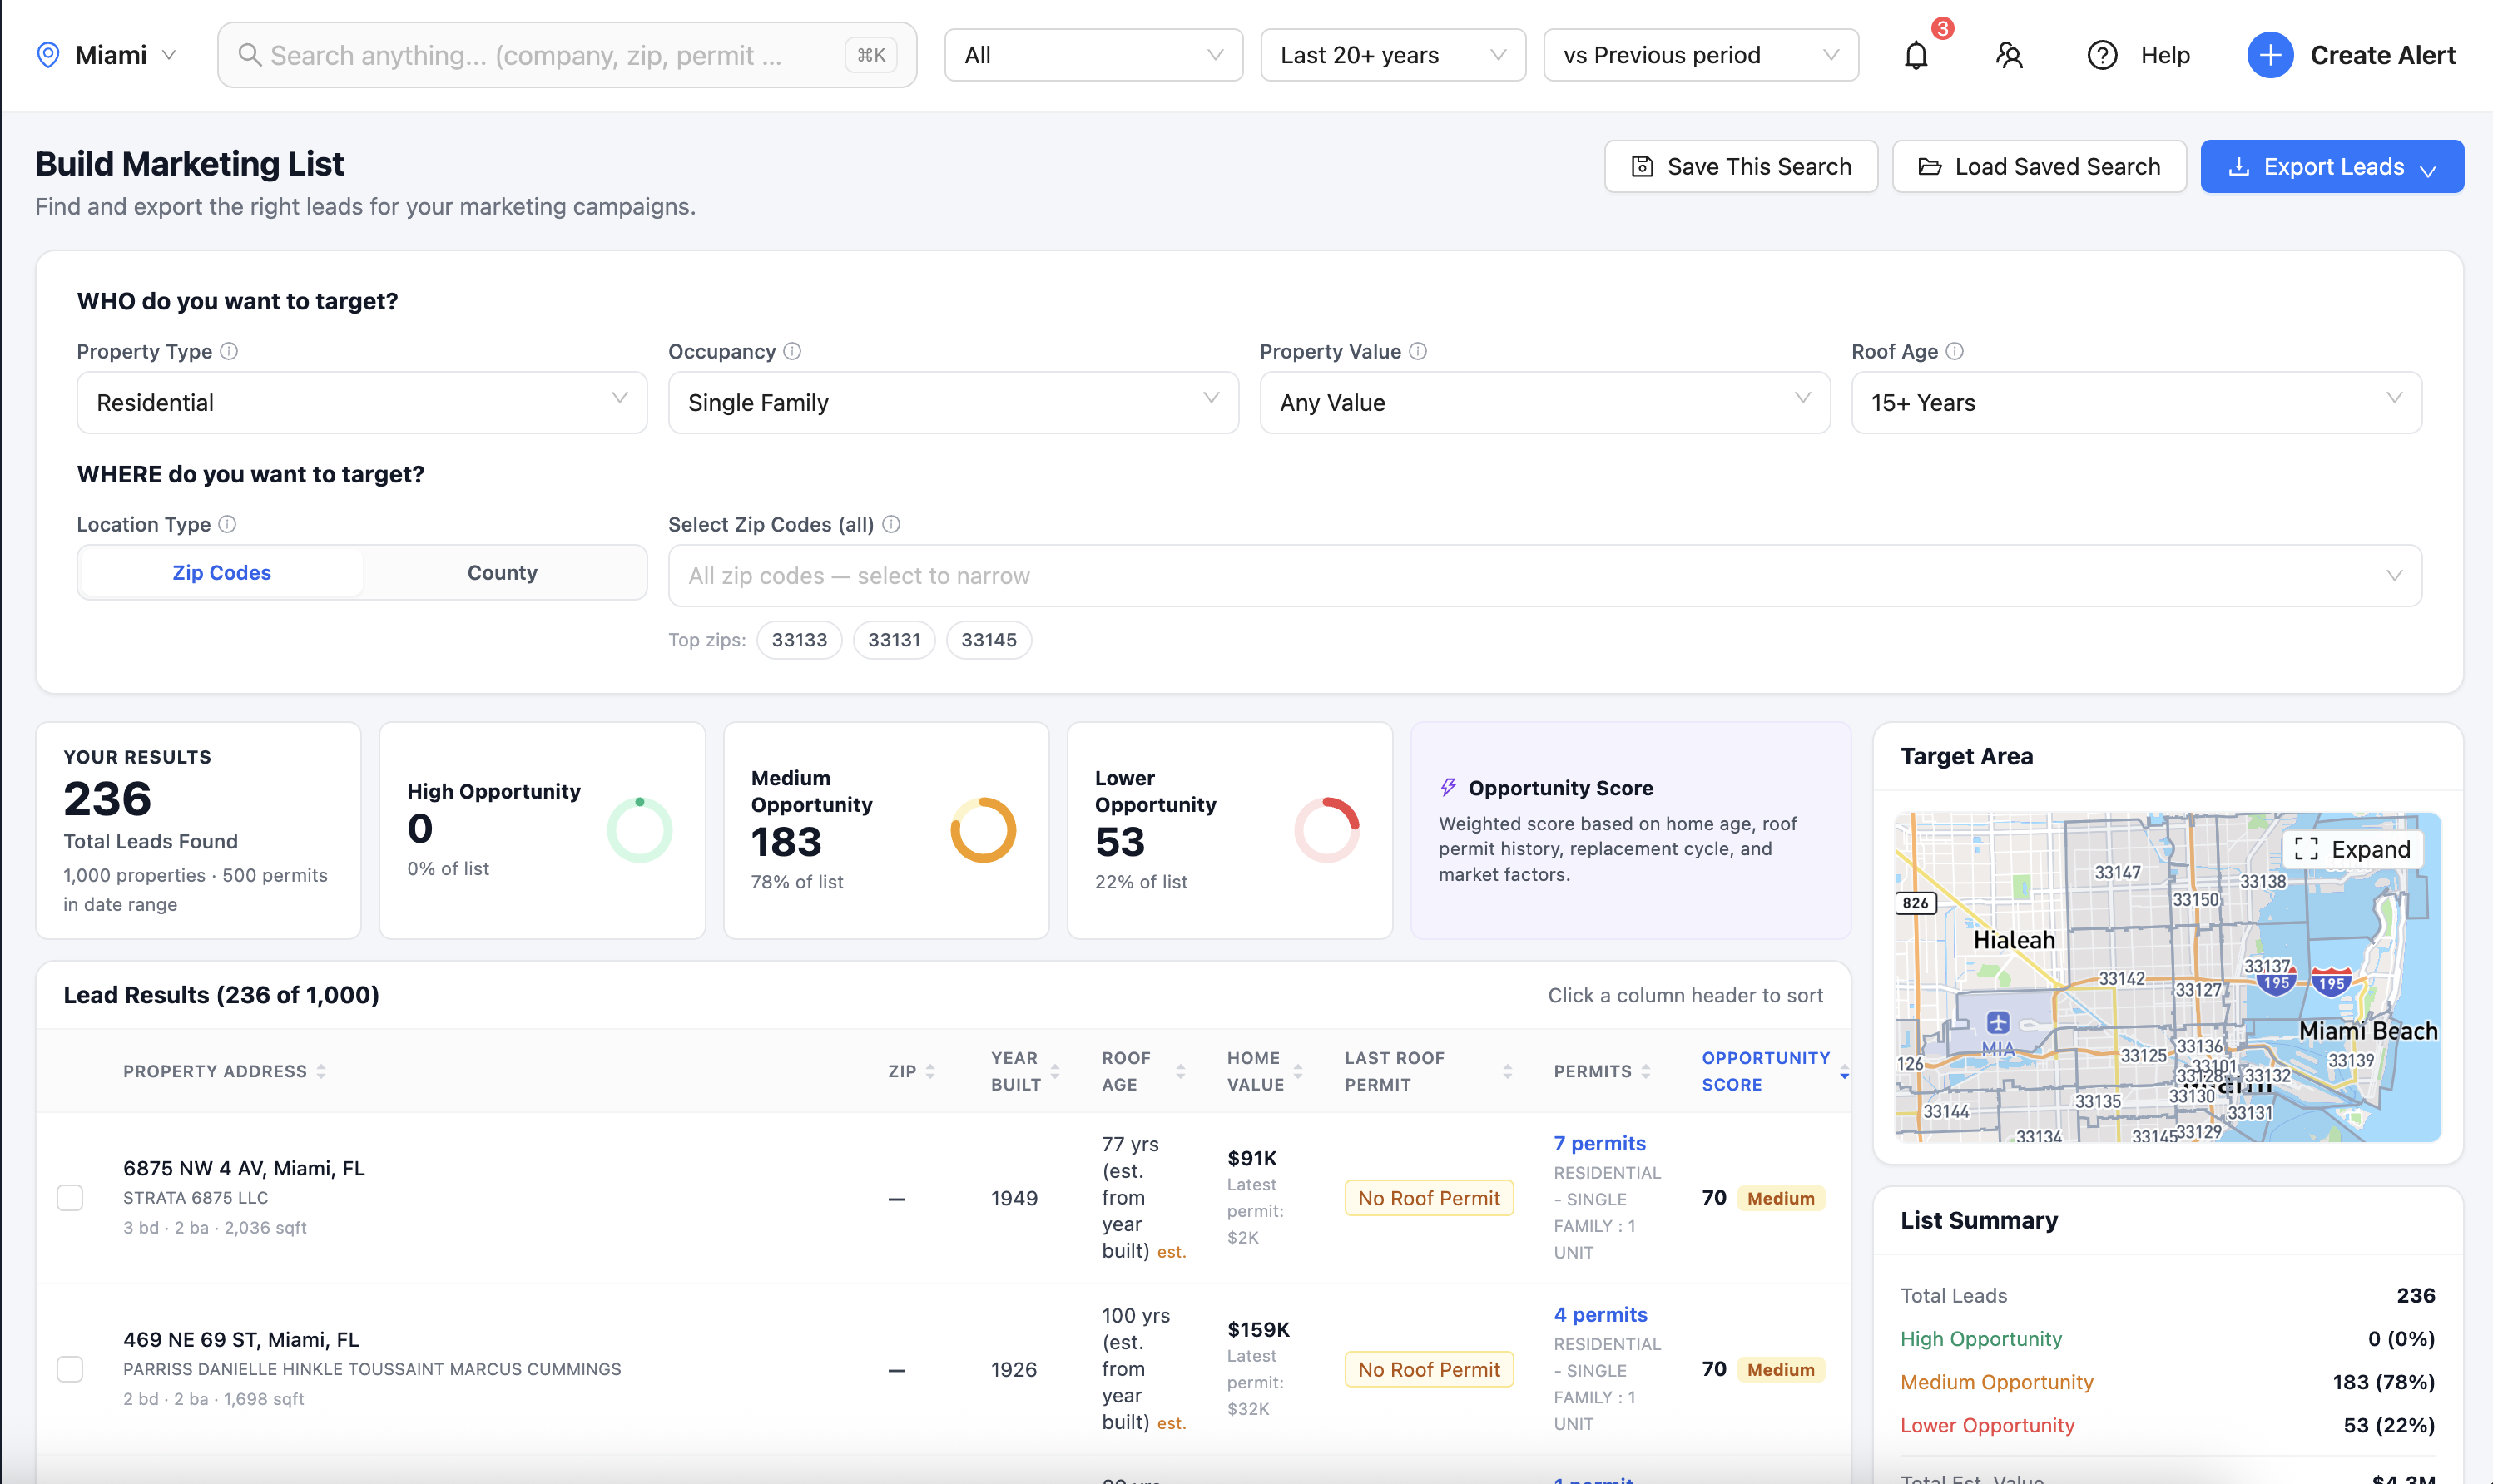
- Lead Finder
- Permits Table
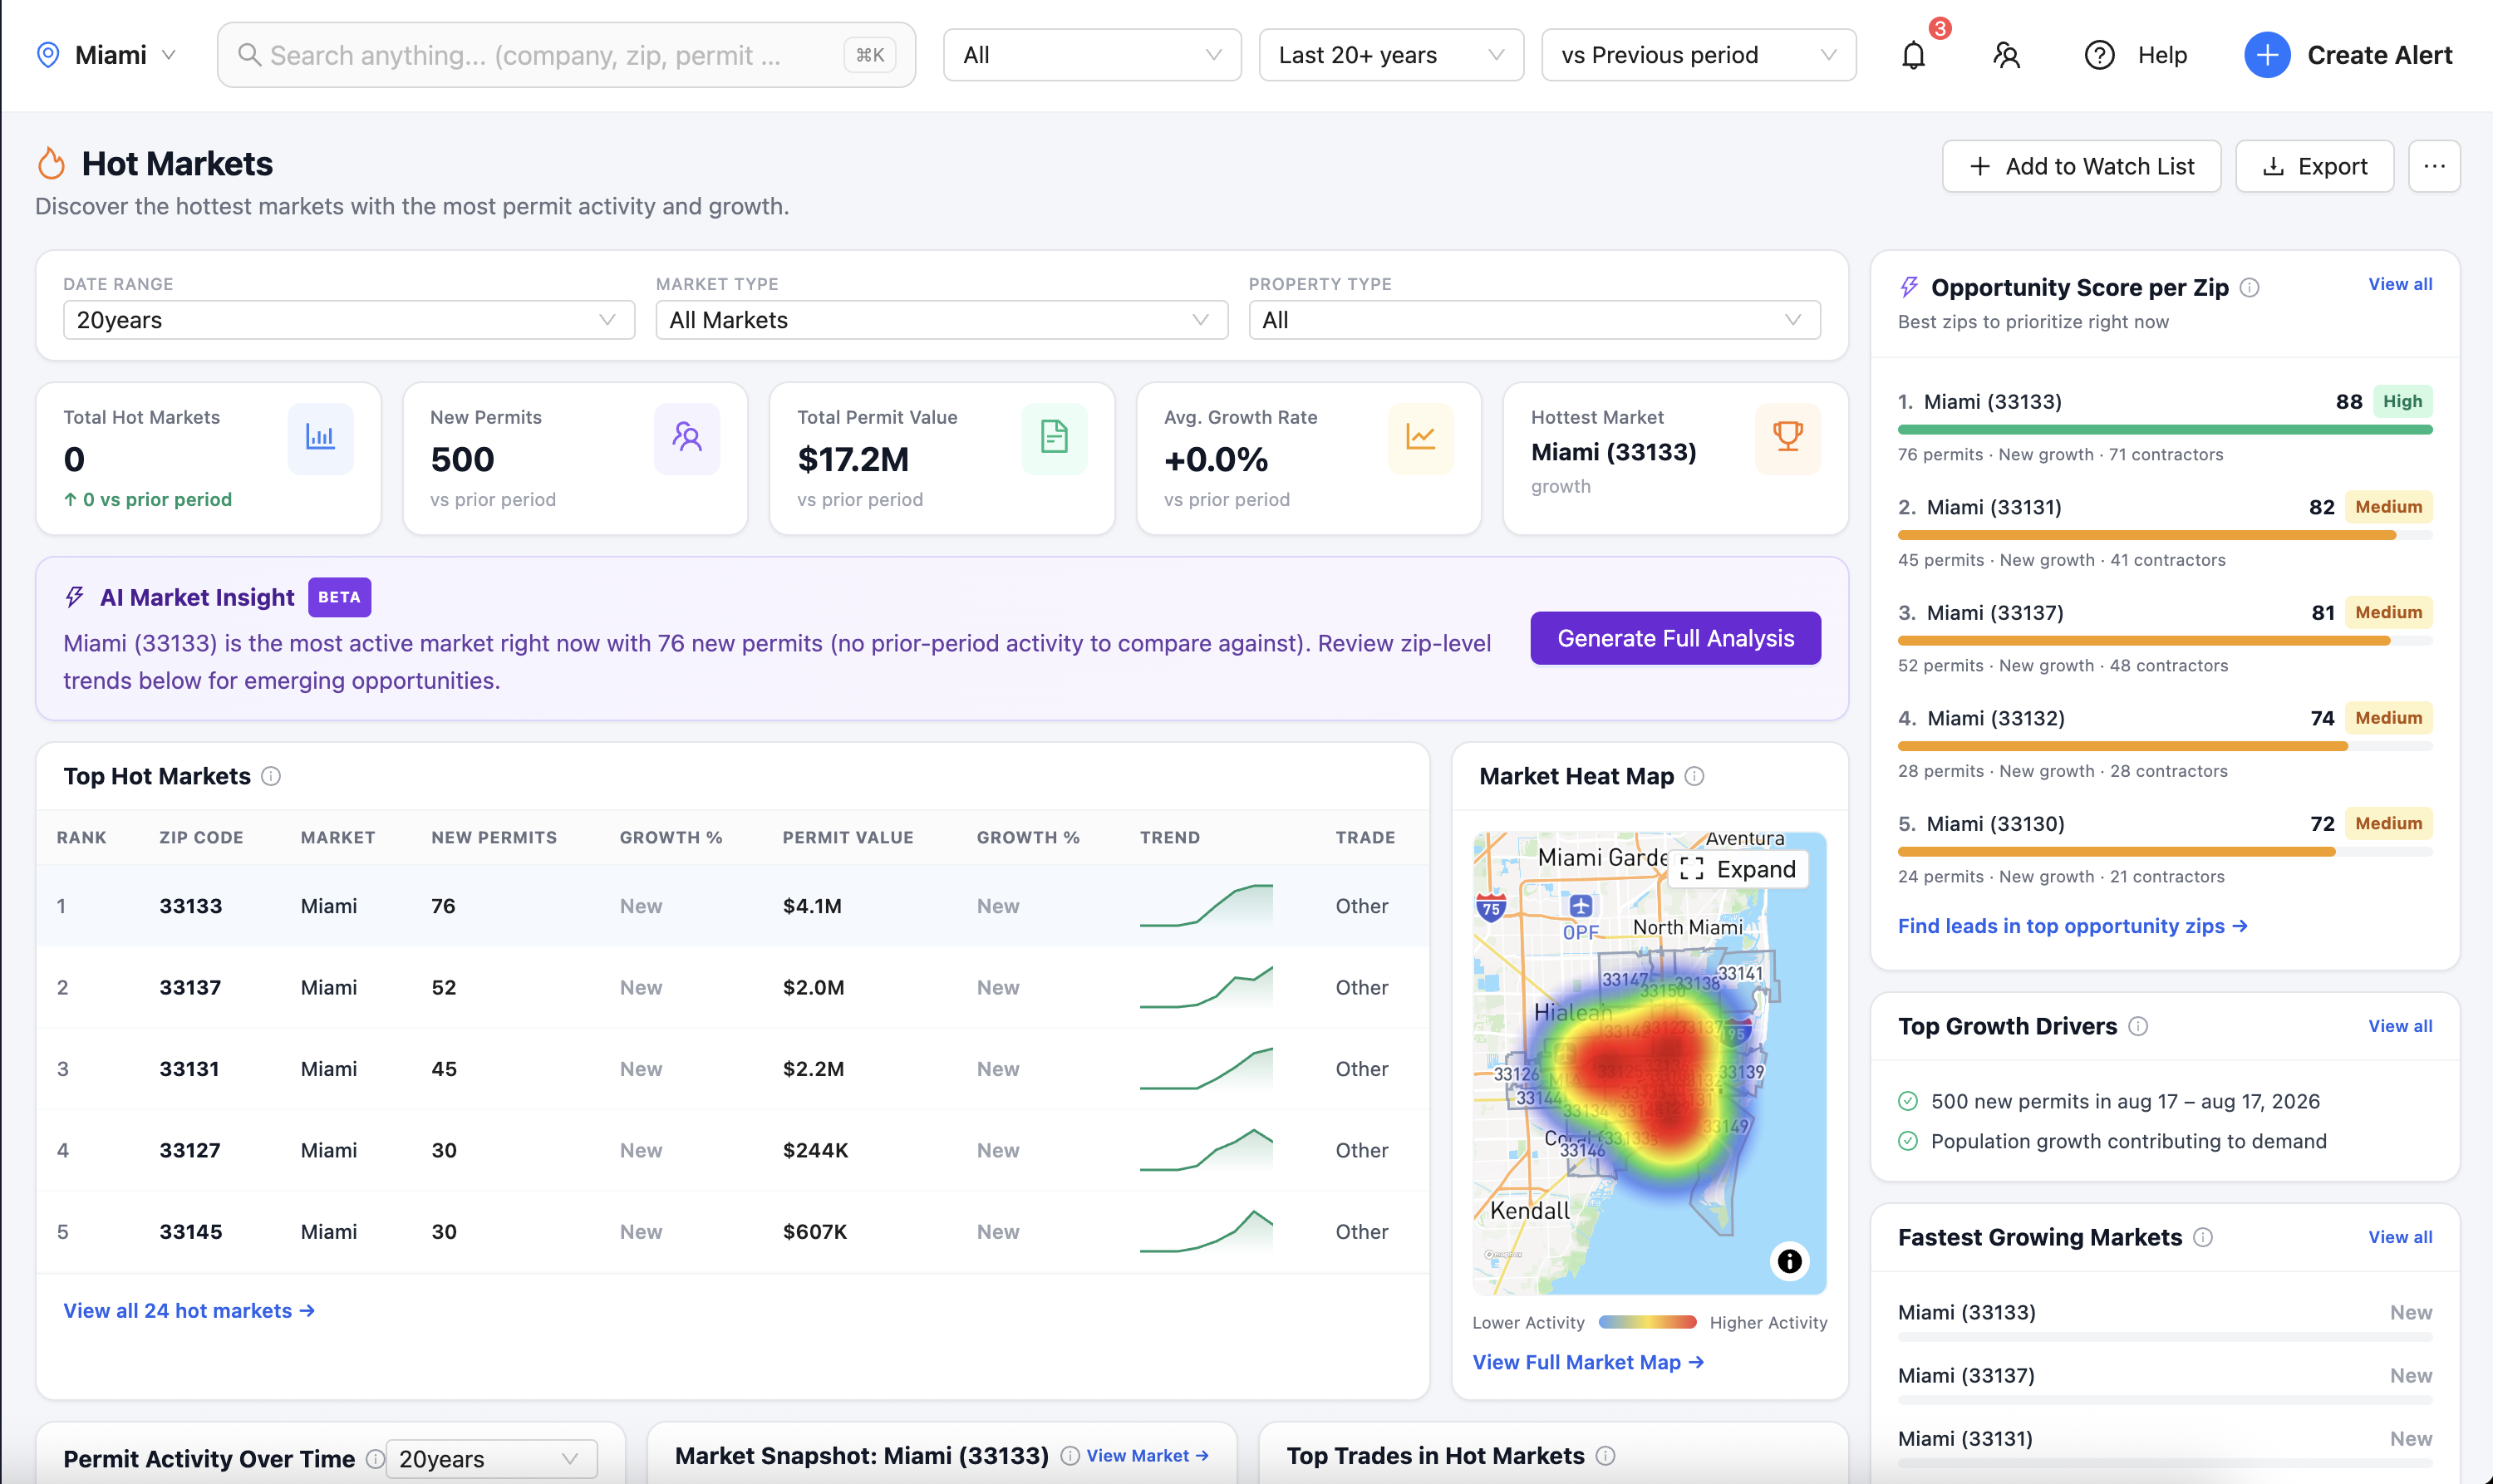
- Hot Markets
Building permit intelligence
We have collected over 5 million public building permits from 60+ markets and add thousands more every day. ContraX cleans them and turns them into scored leads, hot-market maps, and competitor rankings, so you can see who is building what, where, and when.
Free plan includes ContraX Ai for one market. No credit card.
Permits collected
0+
building permits collected, cleaned, and searchable in one place.
60+
Cities and counties covered
12,000+
New permits added every day
20+
Tools in the workspace
What ContraX does
Every building permit is public. Almost nobody has time to read thousands of them. We do the collecting and cleaning, and you get a market you can act on.
Public permit records pulled every day from city and county portals.
Geocoded, deduplicated, and matched to property records in one format.
Each address gets an opportunity score from home age, roof permit history, and market factors.
Dashboards, lead lists, alerts, and plain-English answers from ContraX Ai.
Every permit becomes a lead with the property, the contractor, and a score, so your calls go to the addresses most likely to buy.
See who is pulling permits beside you, how much work they hold, and which ZIP codes they are moving into.
Rank every ZIP by permit activity and opportunity before you buy ads or send a crew.
Permit records are public. Turning them into a decision is the hard part. Here is what contractors, suppliers, and marketers pull out of ContraX every day.
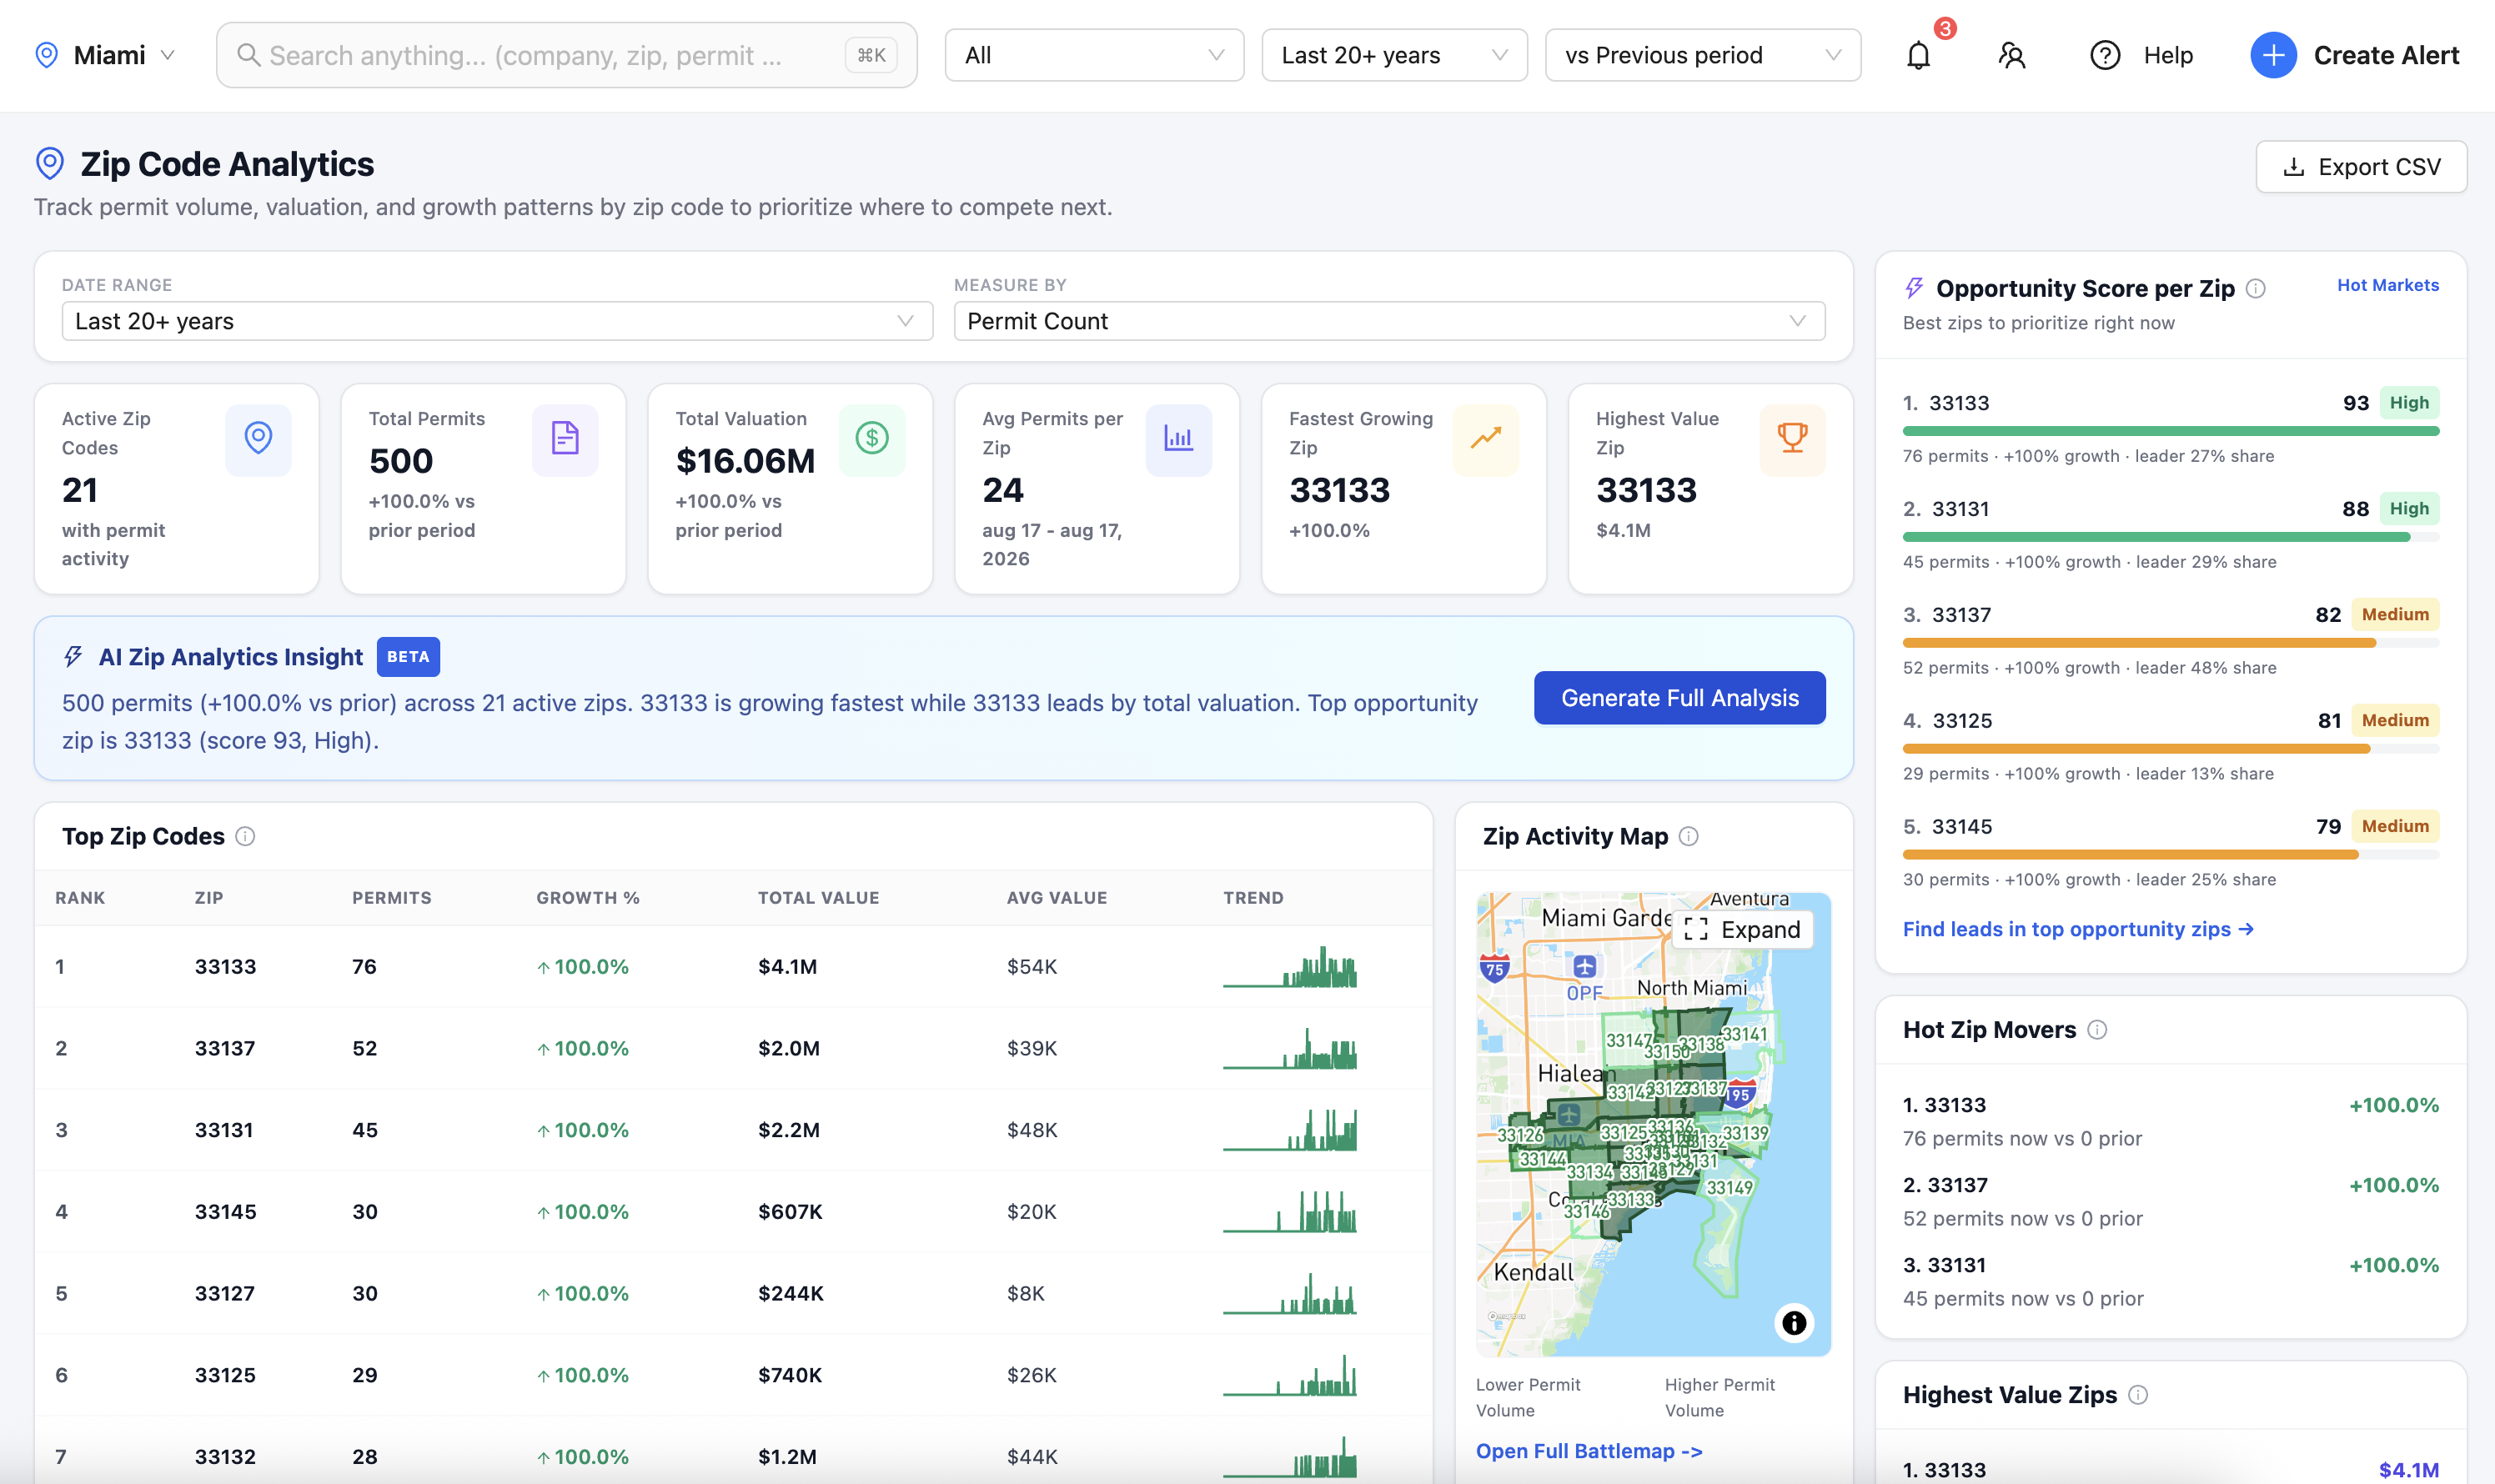
Every ZIP in your market gets ranked by permit volume, permitted value, and an opportunity score, then layered with census income and housing age. You stop guessing which half of your ad spend is working.
Products used
Every ZIP in your market gets ranked by permit volume, permitted value, and an opportunity score, then layered with census income and housing age. You stop guessing which half of your ad spend is working.
Products used
One market free, no card required.
Search a city, county, or ZIP for a last-30-days permit report.
Enter a city or county to see your market intelligence preview.
Try: Tampa, FL · Lee County · Cape Coral
$446.94 in ad spend. $41,389 in new revenue. Here's how Roman Roofing did it.
Featured Client
Cape Coral, FL · Residential Roofing
The Challenge
Roman Roofing needed to grow market share in Cape Coral without increasing their overall marketing budget. The question wasn't how to spend more. It was where to spend smarter.
What ContraX Found
Roman Roofing, Cape Coral FL
Results · Q1 vs Q2 2026
+0%
Qualified Leads
43 → 68 per quarter
+0%
Appointments
40 → 57 per quarter
+0%
Jobs Sold
28 → 34 per quarter
+0%
Booked Revenue
$169K → $211K
Campaign Economics
Market context
Overall permit volume grew just 3% and active competitors increased 23%. Roman Roofing beat the market on every metric.
Full methodology, ZIP level breakdowns, and ROI analysis inside.
Read the full case studyEverything runs on the same daily permit feed, so a lead you find in one tool carries its history, its contractor, and its market context into every other.
Turn raw permits into a list of jobs worth chasing.
Permits Table
Every permit in your markets, searchable and filterable by trade, value, date, and status.
Lead Finder
Scored leads enriched with roof age, home value, and property detail. Save or export the list.
Hot Markets
ZIP-level heatmaps of permit density and opportunity score across your metro.
Growth Areas
The ZIP clusters accelerating fastest by permit velocity over the last 90 days.
Who's Growing
Contractors gaining and losing permit volume, ranked so you can see momentum shift.
Address Lookup
Parcel-level permit history for any address, with the full record and map view.
Own Data
Upload your CRM or bid list and cross-reference it against permits actually pulled.
Know who is winning, where, and how fast.
Company Profiles
Permit counts, market share, valuation, and trend lines for any contractor in your market.
Market Share
Share of permits and permitted value by company, with period-over-period movement.
Battlemap
A geographic view of who owns which territory, valuations plotted ZIP by ZIP.
Rankings
Leaderboards by permit count, value, and growth, linked through to each profile.
For suppliers and manufacturers selling into the trade.
Manufacturer Profiles
Permit volume, share, and growth for every manufacturer appearing in your markets.
Product Usage
Which building products show up on permits, and how share moves between brands.
Manufacturer Map
Geographic distribution of product and manufacturer activity across the market.
The context behind the numbers.
Market Trends
Permit volume and valuation over time, with the ZIPs heating up and cooling off.
Zip Code Analytics
Per-ZIP permit stats and opportunity scores, mapped and ready to export.
Census Data
Population, income, and density layered over permit activity for targeting.
Weather
Hail and storm history correlated to permit locations, so you can chase damage.
Territory Analysis
Compare your coverage against the whole market to find the gaps you are not working.
Let the data come to you.
Alerts
Get notified when new permits hit a ZIP, a competitor moves, or a product appears.
Watch Lists
Follow specific companies, ZIPs, or products and see changes as they happen.
ContraX AI
Ask anything about your market in plain English and get a sourced, structured answer.
ContraX Ai sits on top of our entire permit corpus and delivers analyst grade responses in seconds. Ask about markets, contractors, project pipelines, or specific leads in plain English.
Try an example
Ask anything about permit activity, contractors, and markets in plain English.
or pick a question from the list
Coverage
Browse 60+ cities and counties with building permits, contractors, roof age, roofing leads, and ContraX Ai for every market we cover.
5,000,000+
permits normalized into one format
Get started
No data team, no spreadsheets, no scraping. Start on the free plan and move up when the data pays for itself.
Sign up with your email. No credit card and no sales call.
About 30 seconds
Choose the city or county you work in. Every plan starts with at least one market.
Free plan: 1 market
Ask ContraX Ai about your market right away. Upgrade when you want the Permits Table, Lead Finder, competitor boards, and exports.
Upgrade any time
Pricing
Full ContraX access scales with the number of jurisdictions you need. Annual billing saves 10% on paid plans.
Google for permitting. Start relying on it
$0
1 JURISDICTION
Free includes the ContraX Ai tab only. Upgrade to unlock dashboards, leads, and the rest of the workspace.
The every contractor plan
$25/mo
2 TO 3 JURISDICTIONS
Full Contrax: dashboards, leads, competition
$249/mo
UP TO 8 JURISDICTIONS
Custom solutions for large teams and multi region operations
Contact us
9+ JURISDICTIONS
Join construction professionals who run on ContraX permit intelligence. Start on the free plan. No credit card, no sales call required.
5M+ permits collected60+ marketsUpdated daily20+ data productsNo credit card required