If you’re a roofing contractor in Columbus, Ohio, you probably already know the market has been busy. You see the trucks, the yard signs, the new roofs going on, and the same competitors showing up in neighborhoods over and over again. What’s harder to understand is how much activity is actually happening, where that activity is concentrated, and whether the growth you’re seeing is part of a larger trend or just something temporary.
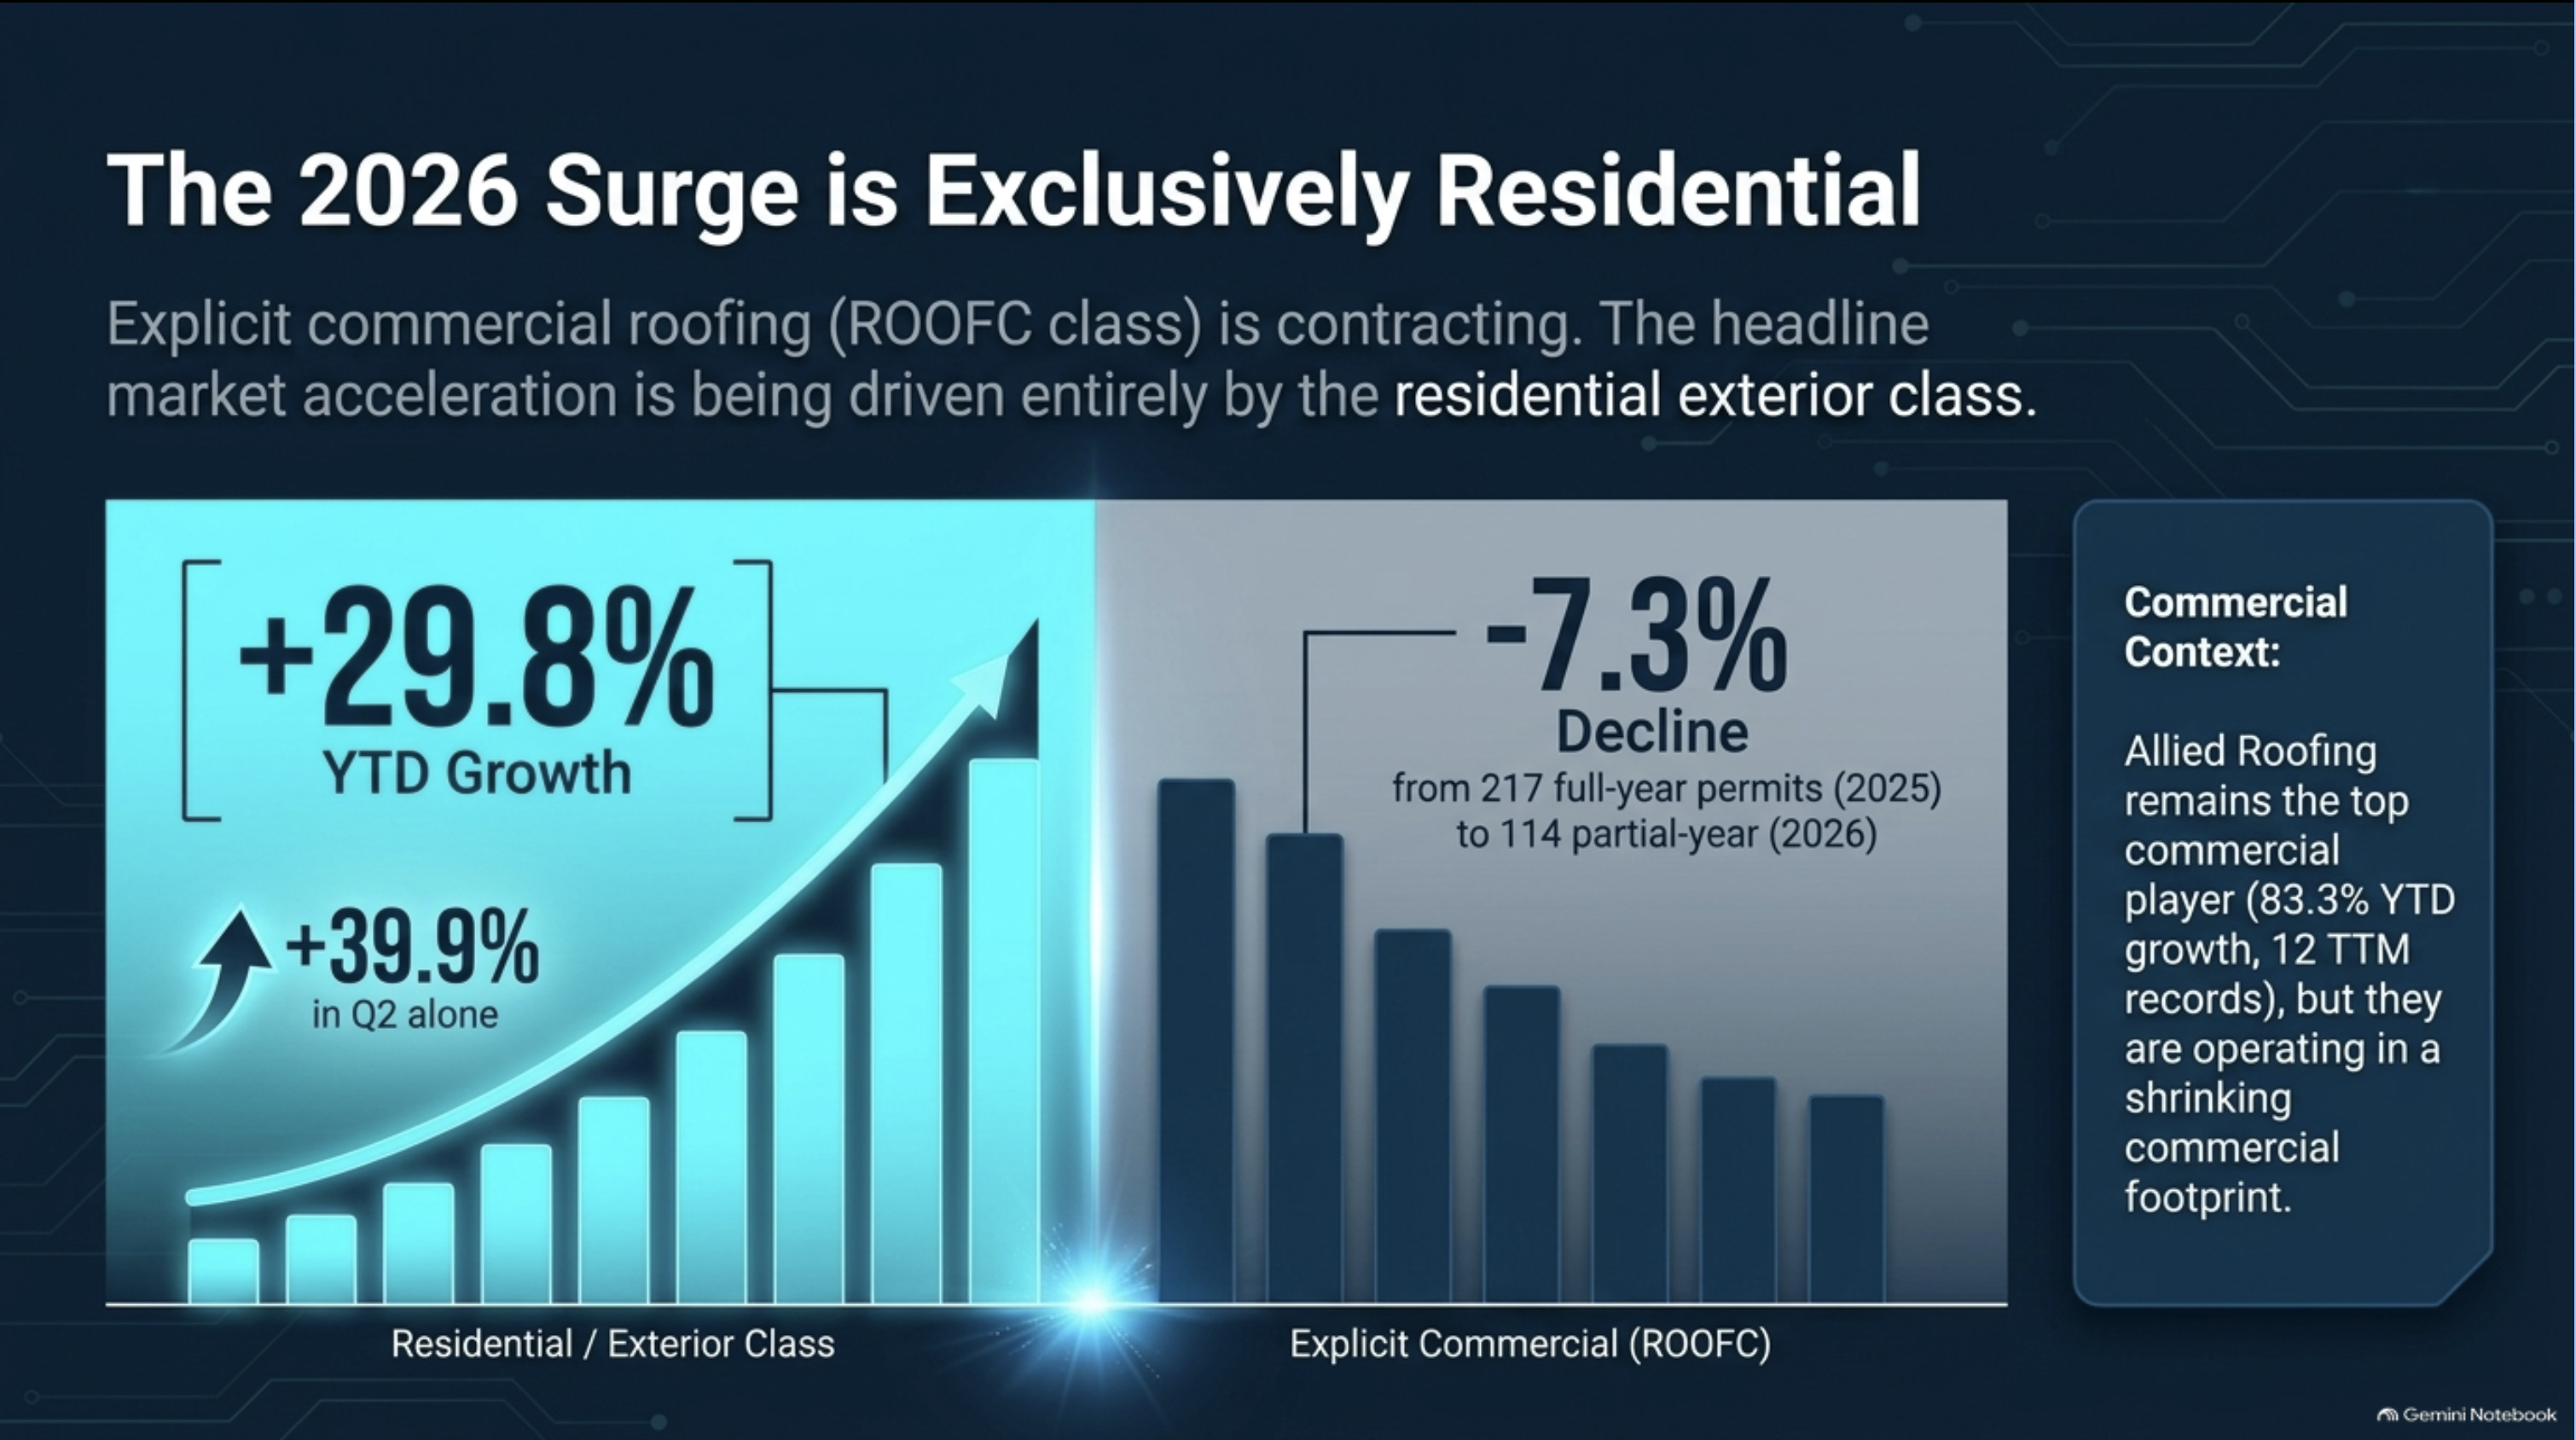
That’s what we wanted to figure out. We analyzed Columbus roofing activity alongside housing and demographic data to get a better picture of what is actually happening across the market. One number immediately stood out: Columbus roofing activity increased 20.6%. That is a meaningful jump, but once we started digging deeper, the 20.6% wasn’t actually the most interesting part of the analysis. The real story was what was happening underneath that headline.

Columbus Roofing Activity Is Up, But the Growth Isn’t Evenly Distributed
When you hear that roofing activity in Columbus increased 20.6%, it’s easy to assume the entire market is booming. The problem with citywide numbers is that they can hide a lot of what is actually going on at the neighborhood and ZIP-code level. One area can be accelerating while another stays flat, and one contractor can grow dramatically while the rest of the market remains relatively stable.
That’s why we didn’t want to stop at the overall growth number. We wanted to understand what was causing it. Which parts of Columbus were producing the most roofing activity? Which neighborhoods had the strongest concentration of projects? Were certain contractors taking a larger share of the market? And most importantly, what could a roofing company actually do with that information?
Looking at Roofing Activity by ZIP Code
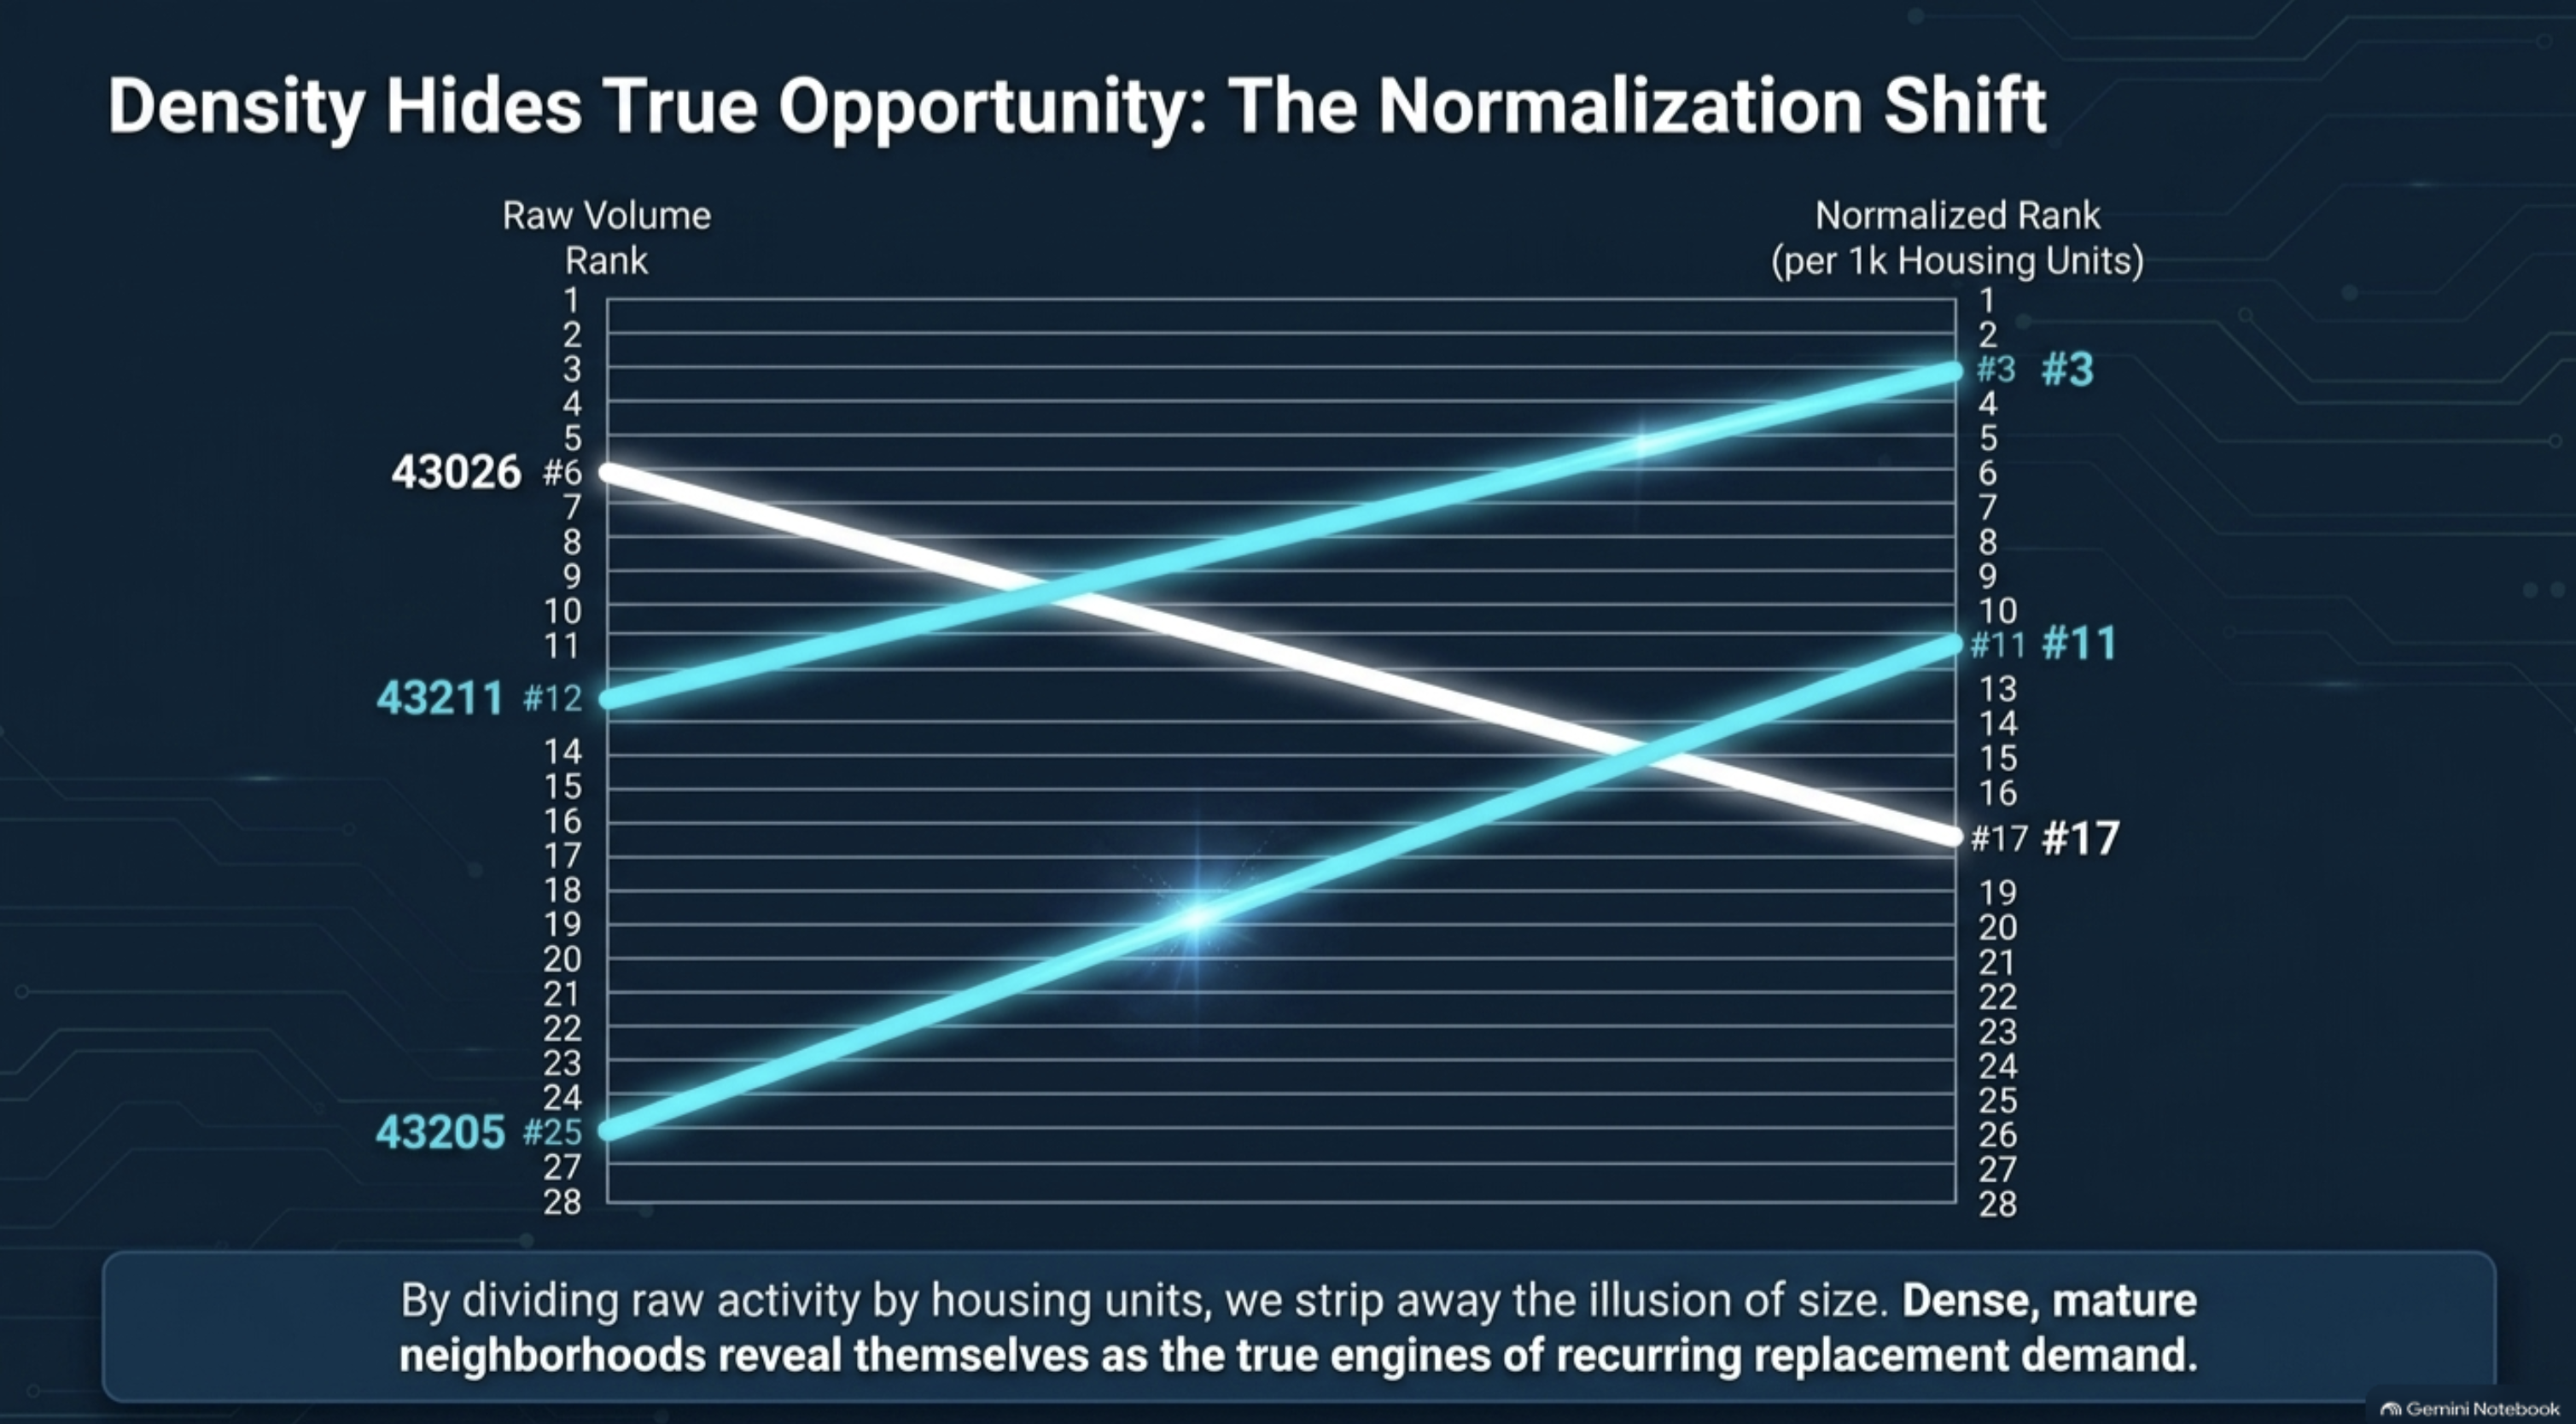
One of the first things we looked at was roofing activity by ZIP code. Raw project totals are useful, but they can also be misleading because larger ZIP codes naturally have more homes and therefore more opportunities for roofing projects.
For example, imagine one ZIP code has 1,000 roofing projects but contains 50,000 housing units, while another has 600 projects but only 10,000 housing units. If you only looked at total project count, the first ZIP would appear stronger. But relative to the number of homes available, the second ZIP actually has a much higher concentration of roofing activity.
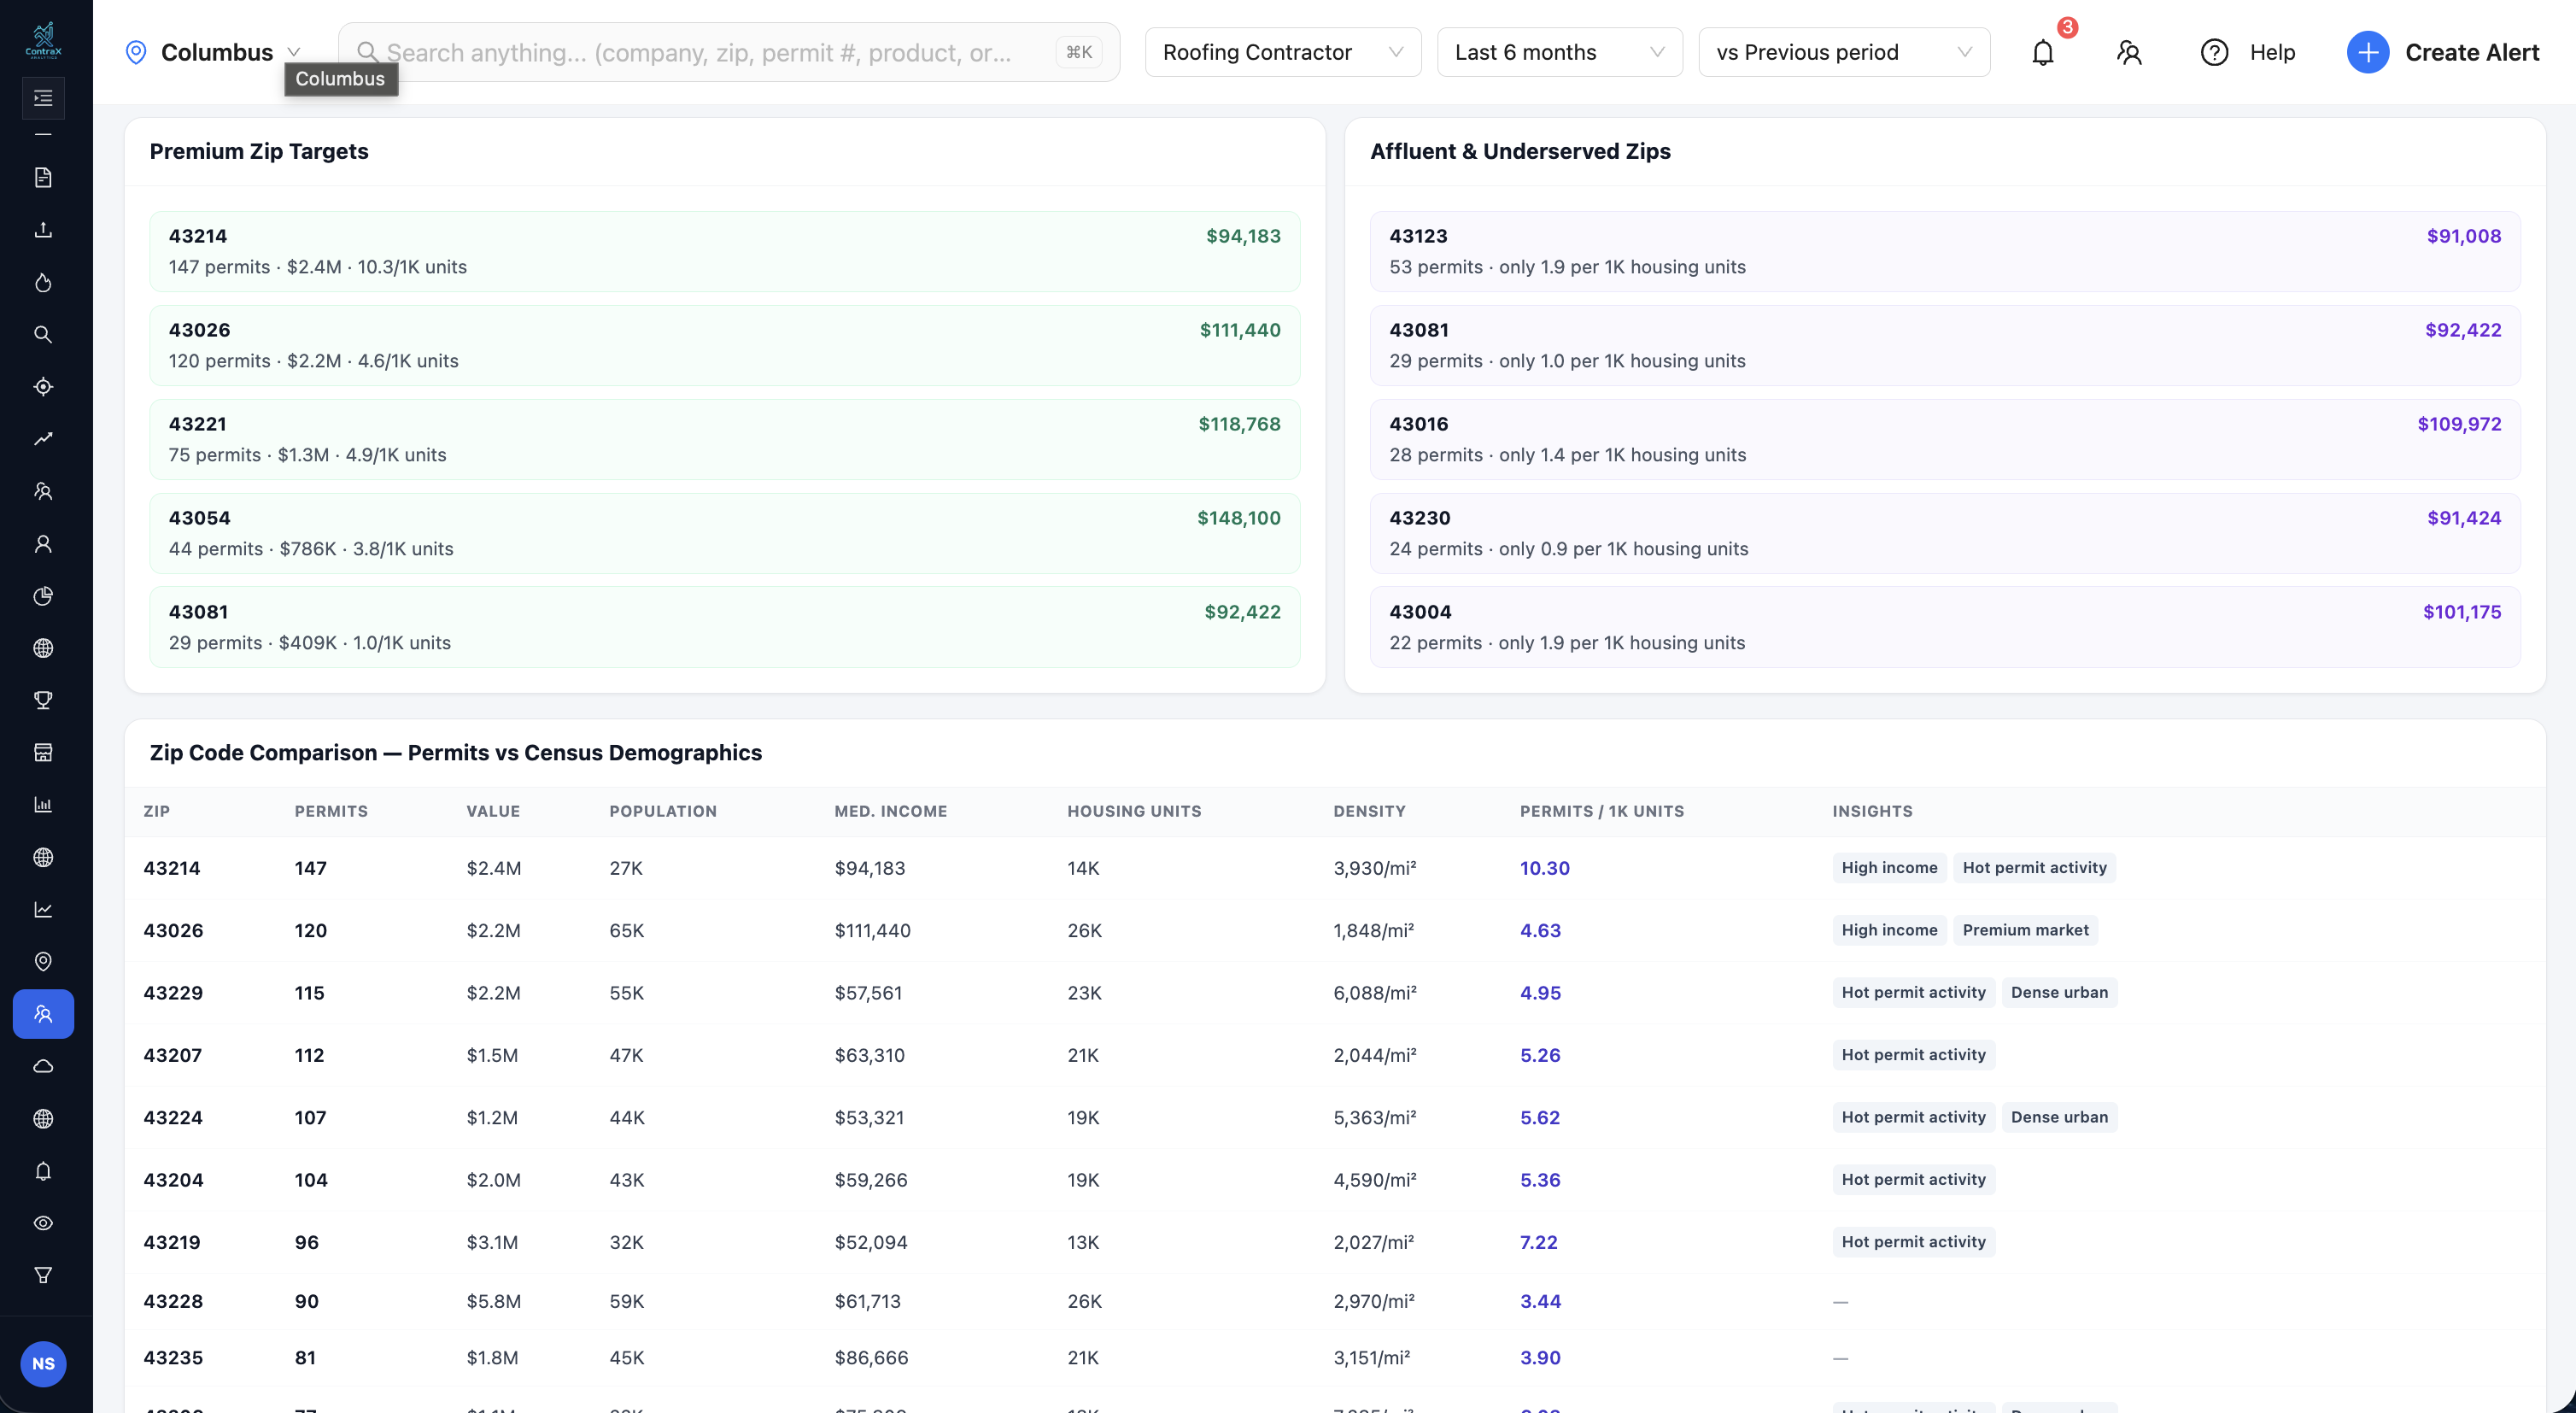
That’s why we also calculate roofing projects per 1,000 housing units. This gives us a more normalized way to compare different parts of the Columbus roofing market and helps prevent larger ZIP codes from automatically looking like the best opportunity simply because they contain more homes.
For a contractor, that distinction matters. If you’re deciding where to spend marketing dollars, send canvassers, build referral relationships, or focus your sales team, you probably care just as much about the concentration of demand as you do the total amount of activity.
43214 Continues to Stand Out
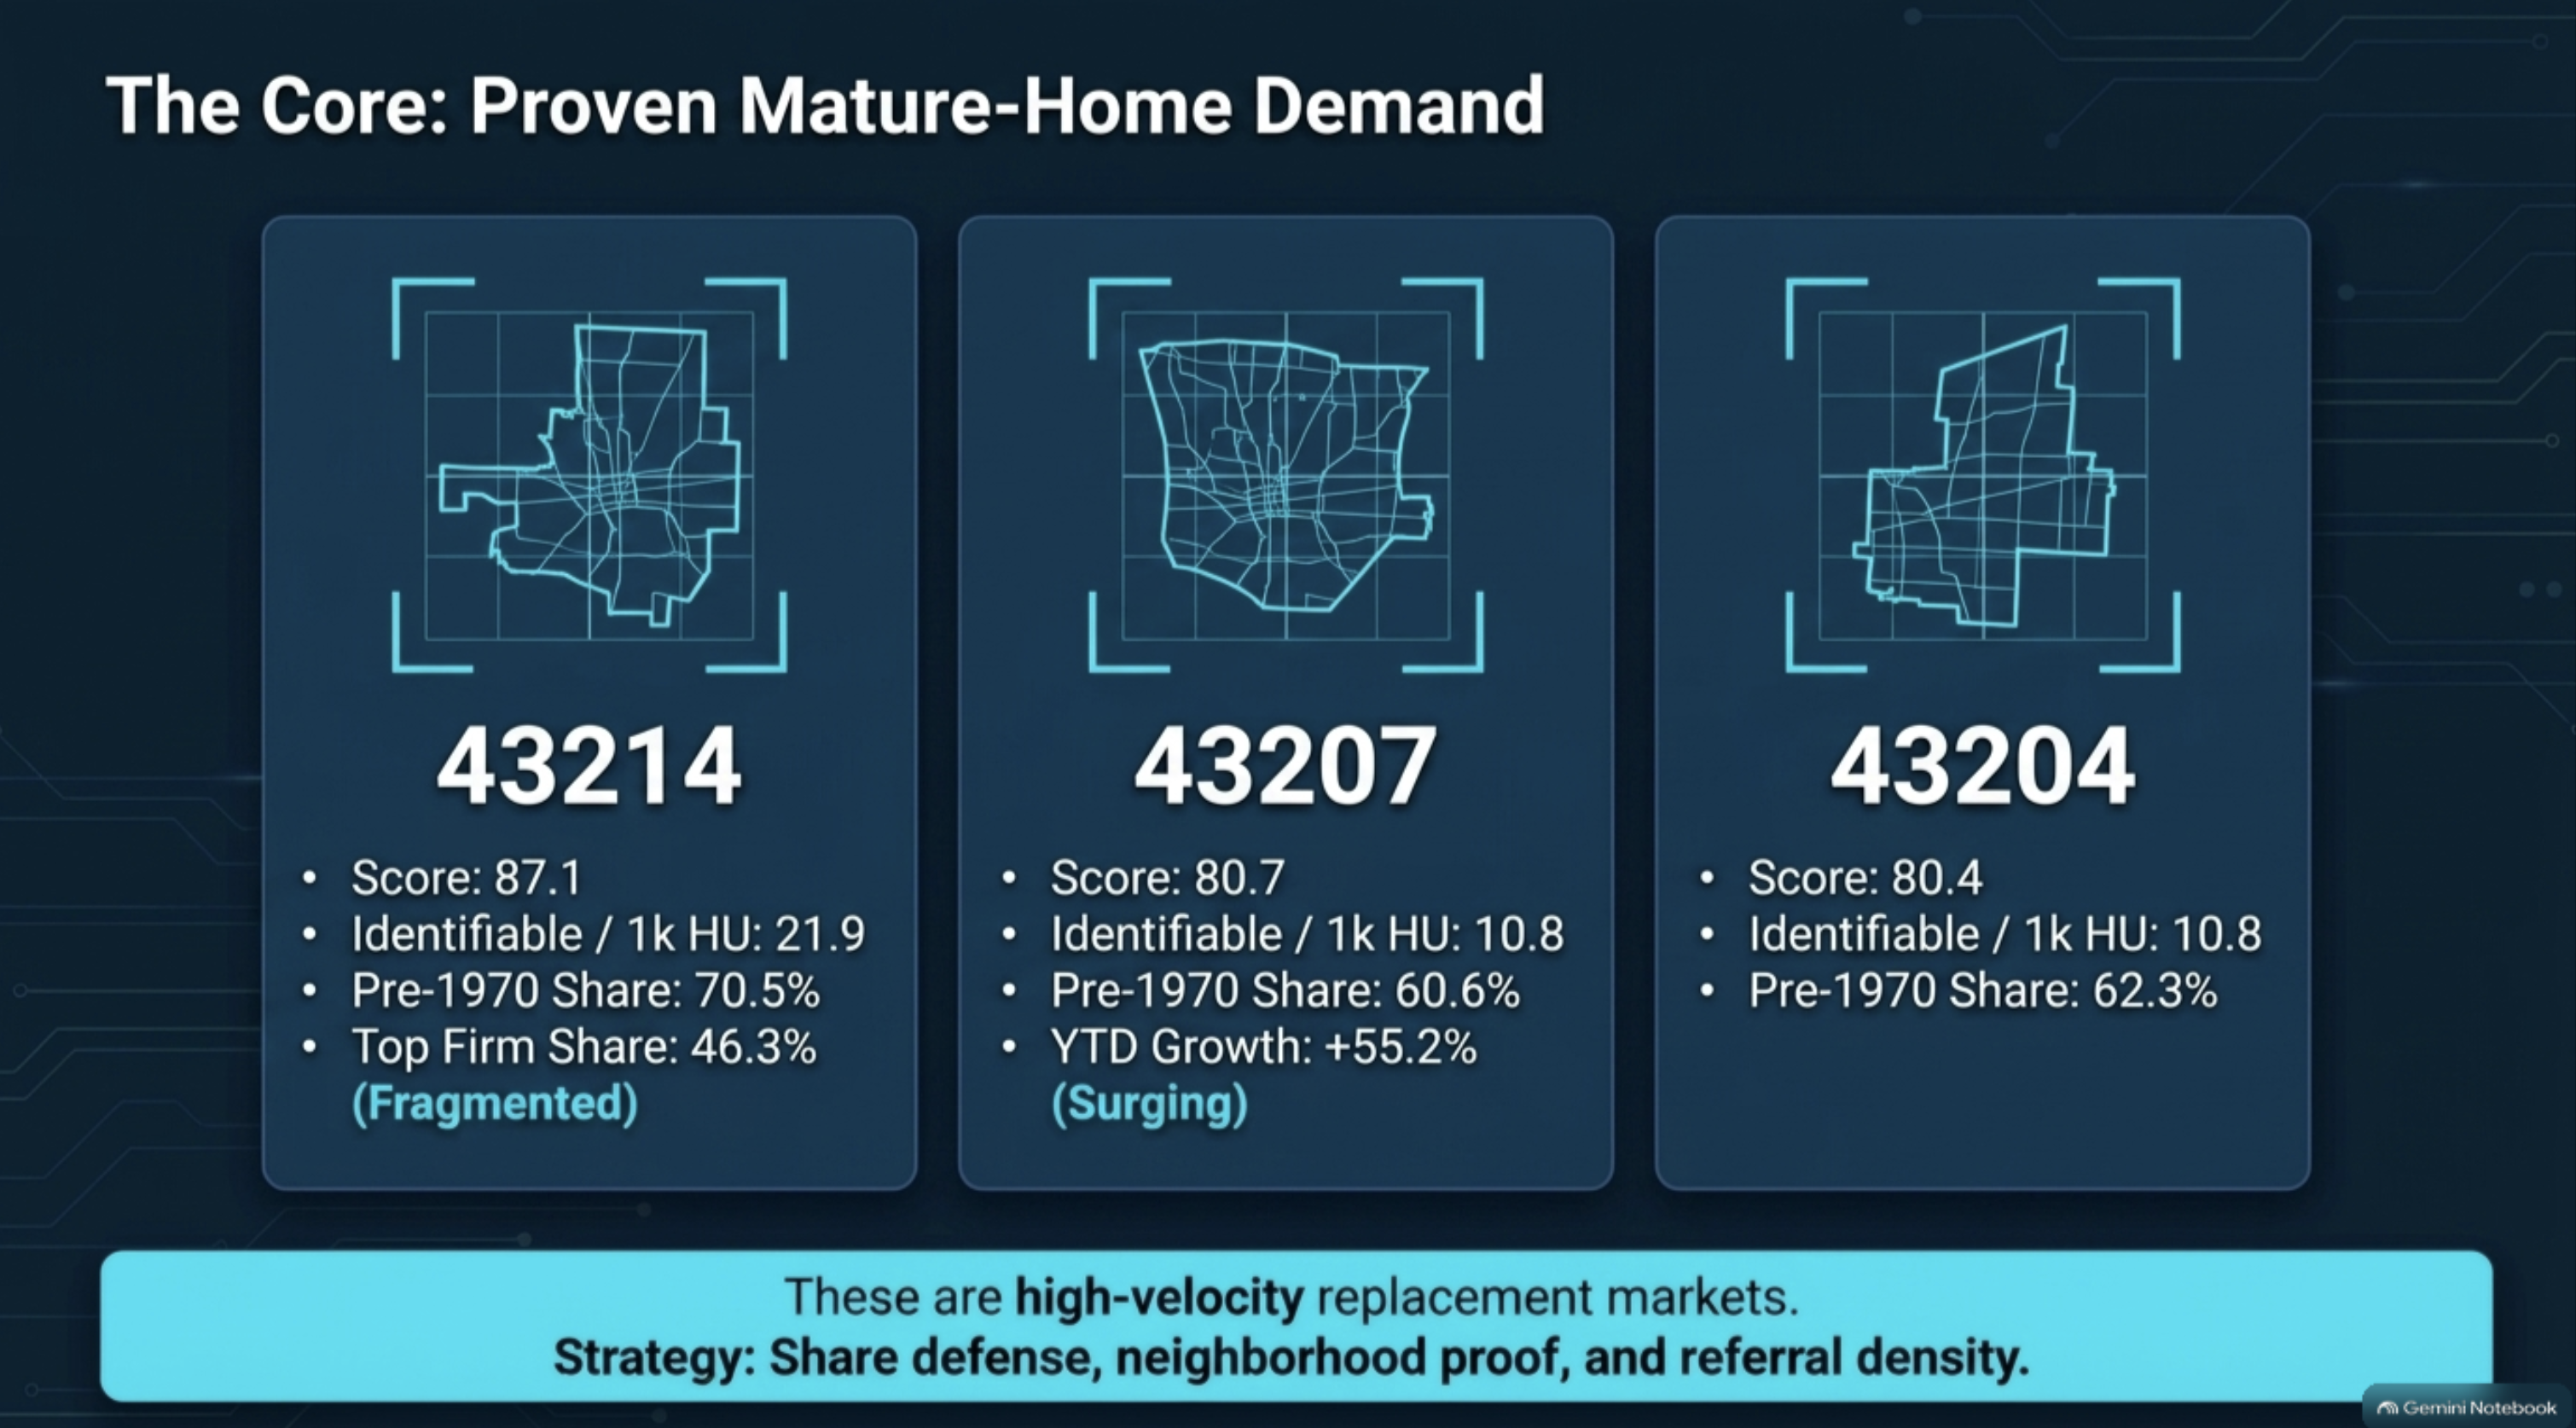
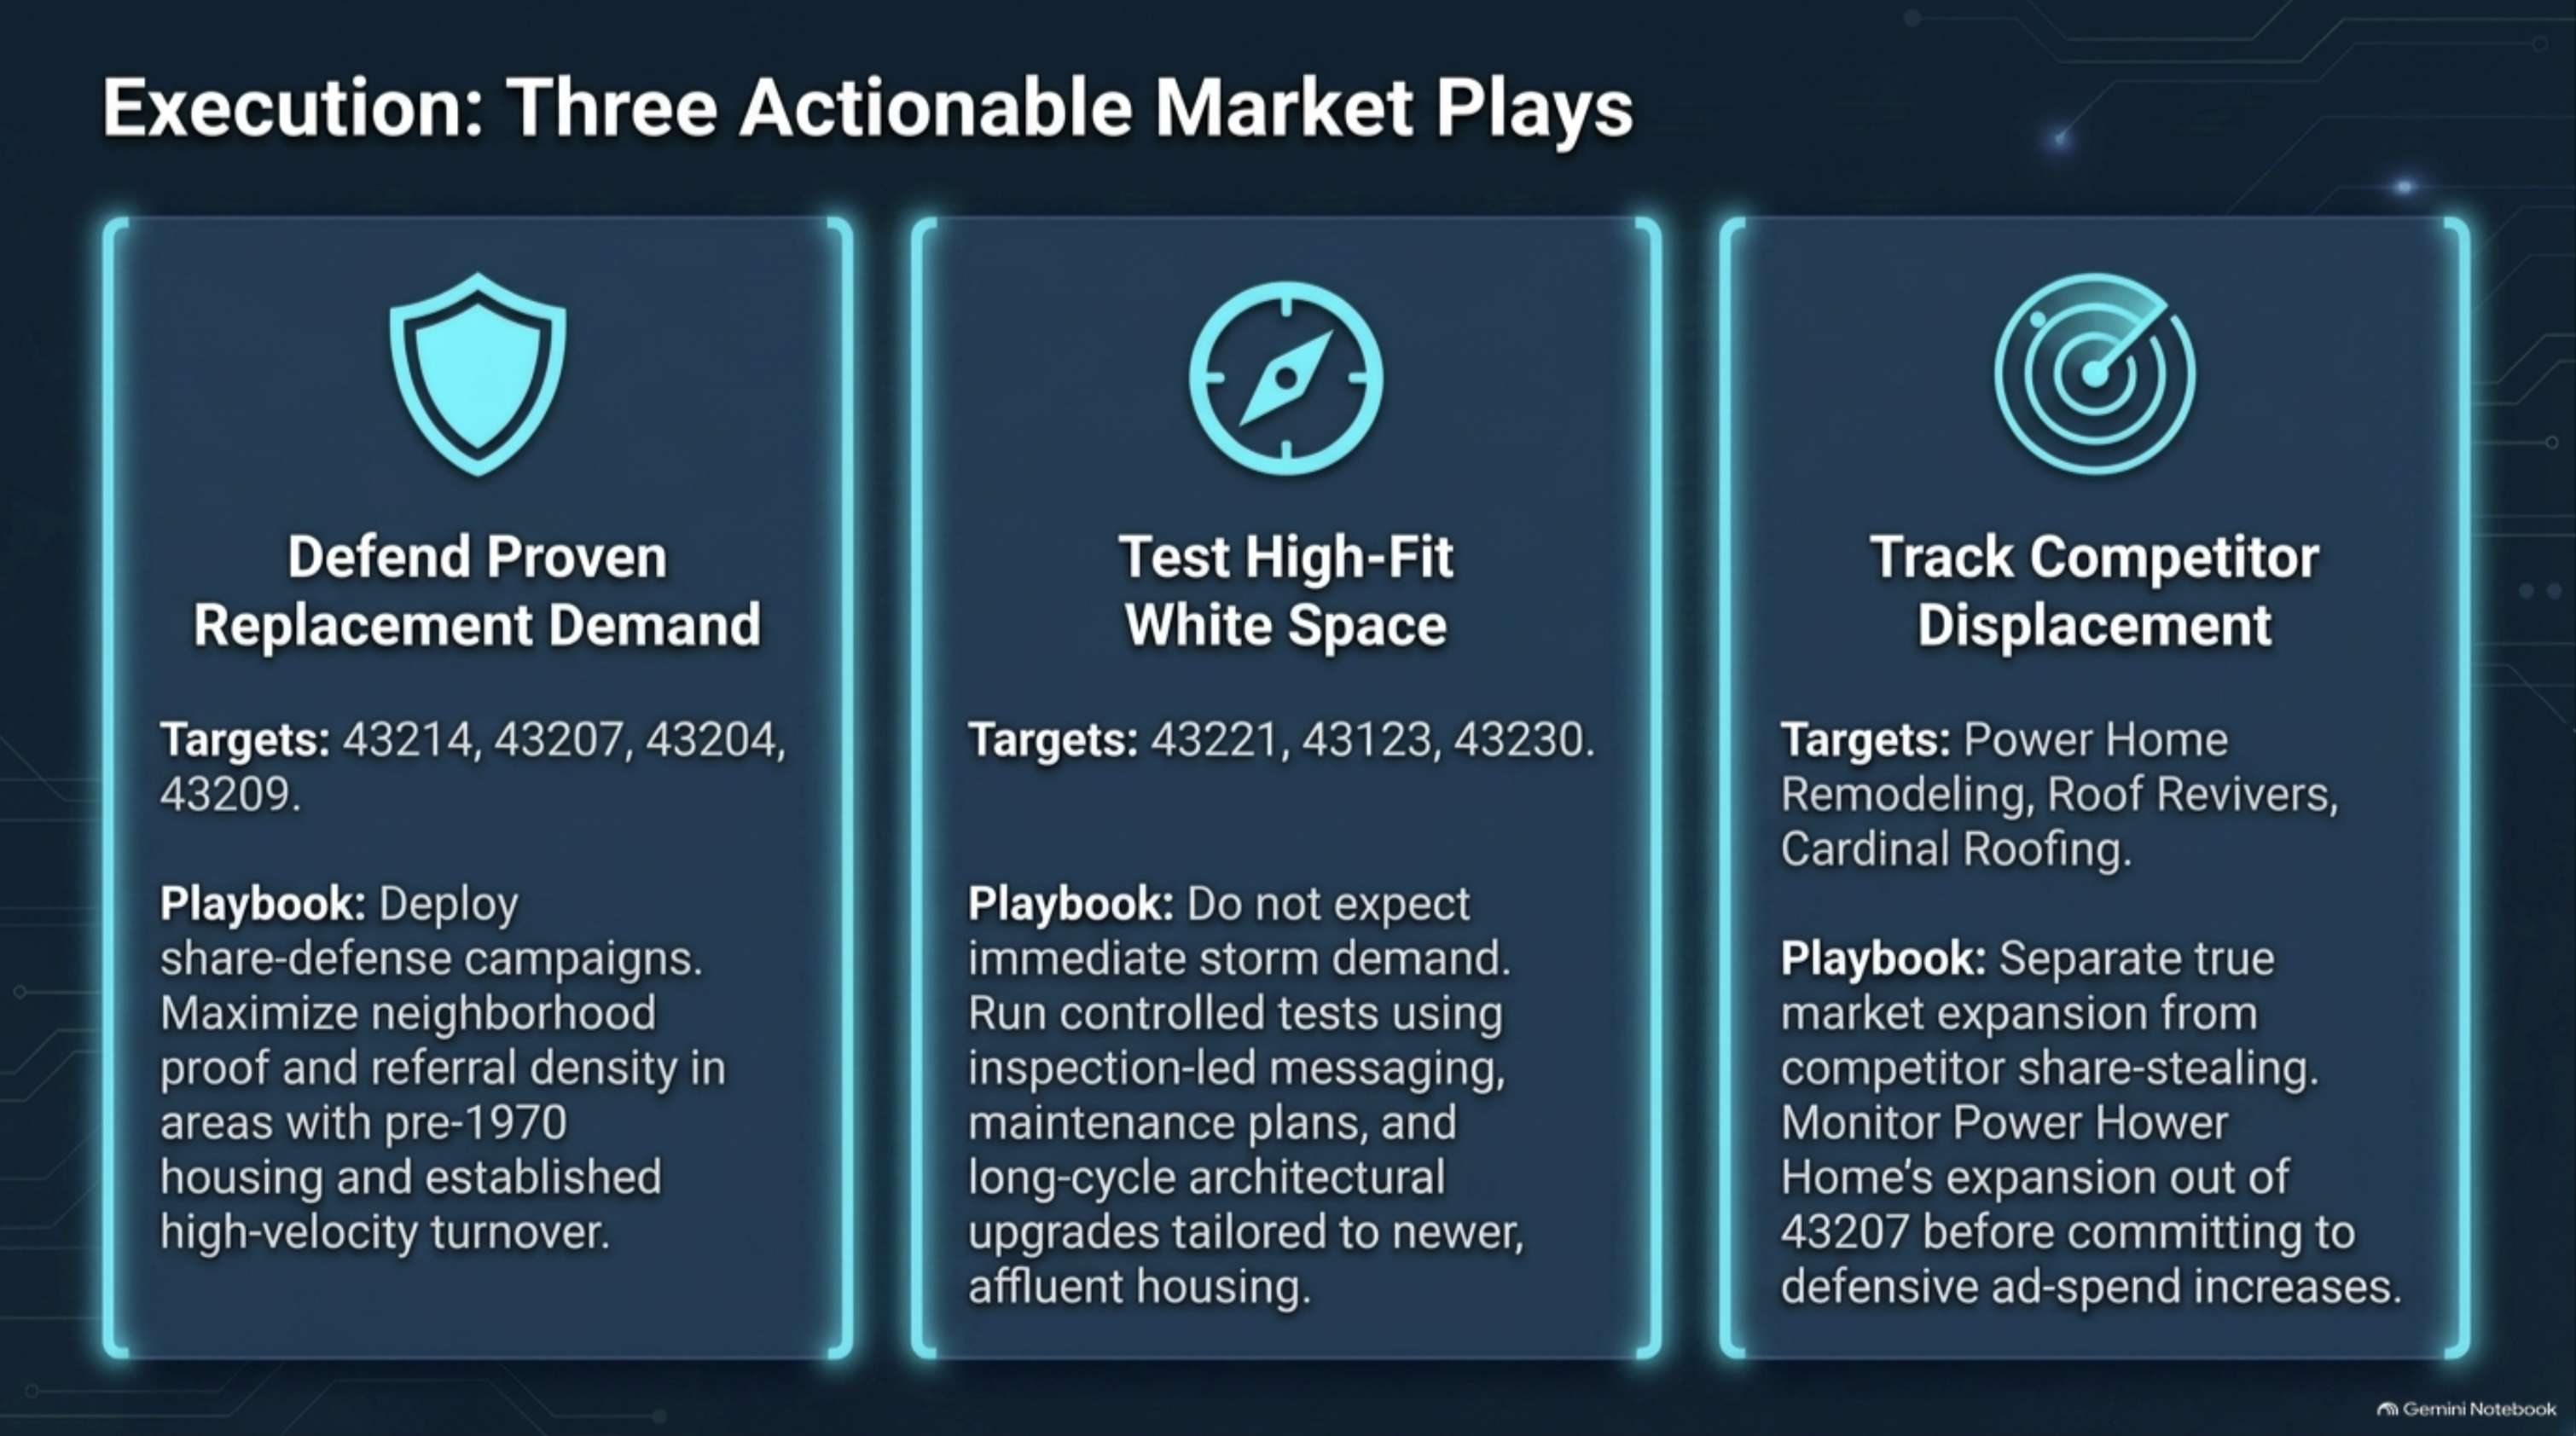
One of the strongest areas in our Columbus roofing analysis was ZIP code 43214, which includes parts of Clintonville and north-central Columbus. In our analysis, the ZIP produced approximately 36.7 roofing projects per 1,000 housing units, making it one of the strongest areas when activity was normalized against the size of the housing market.
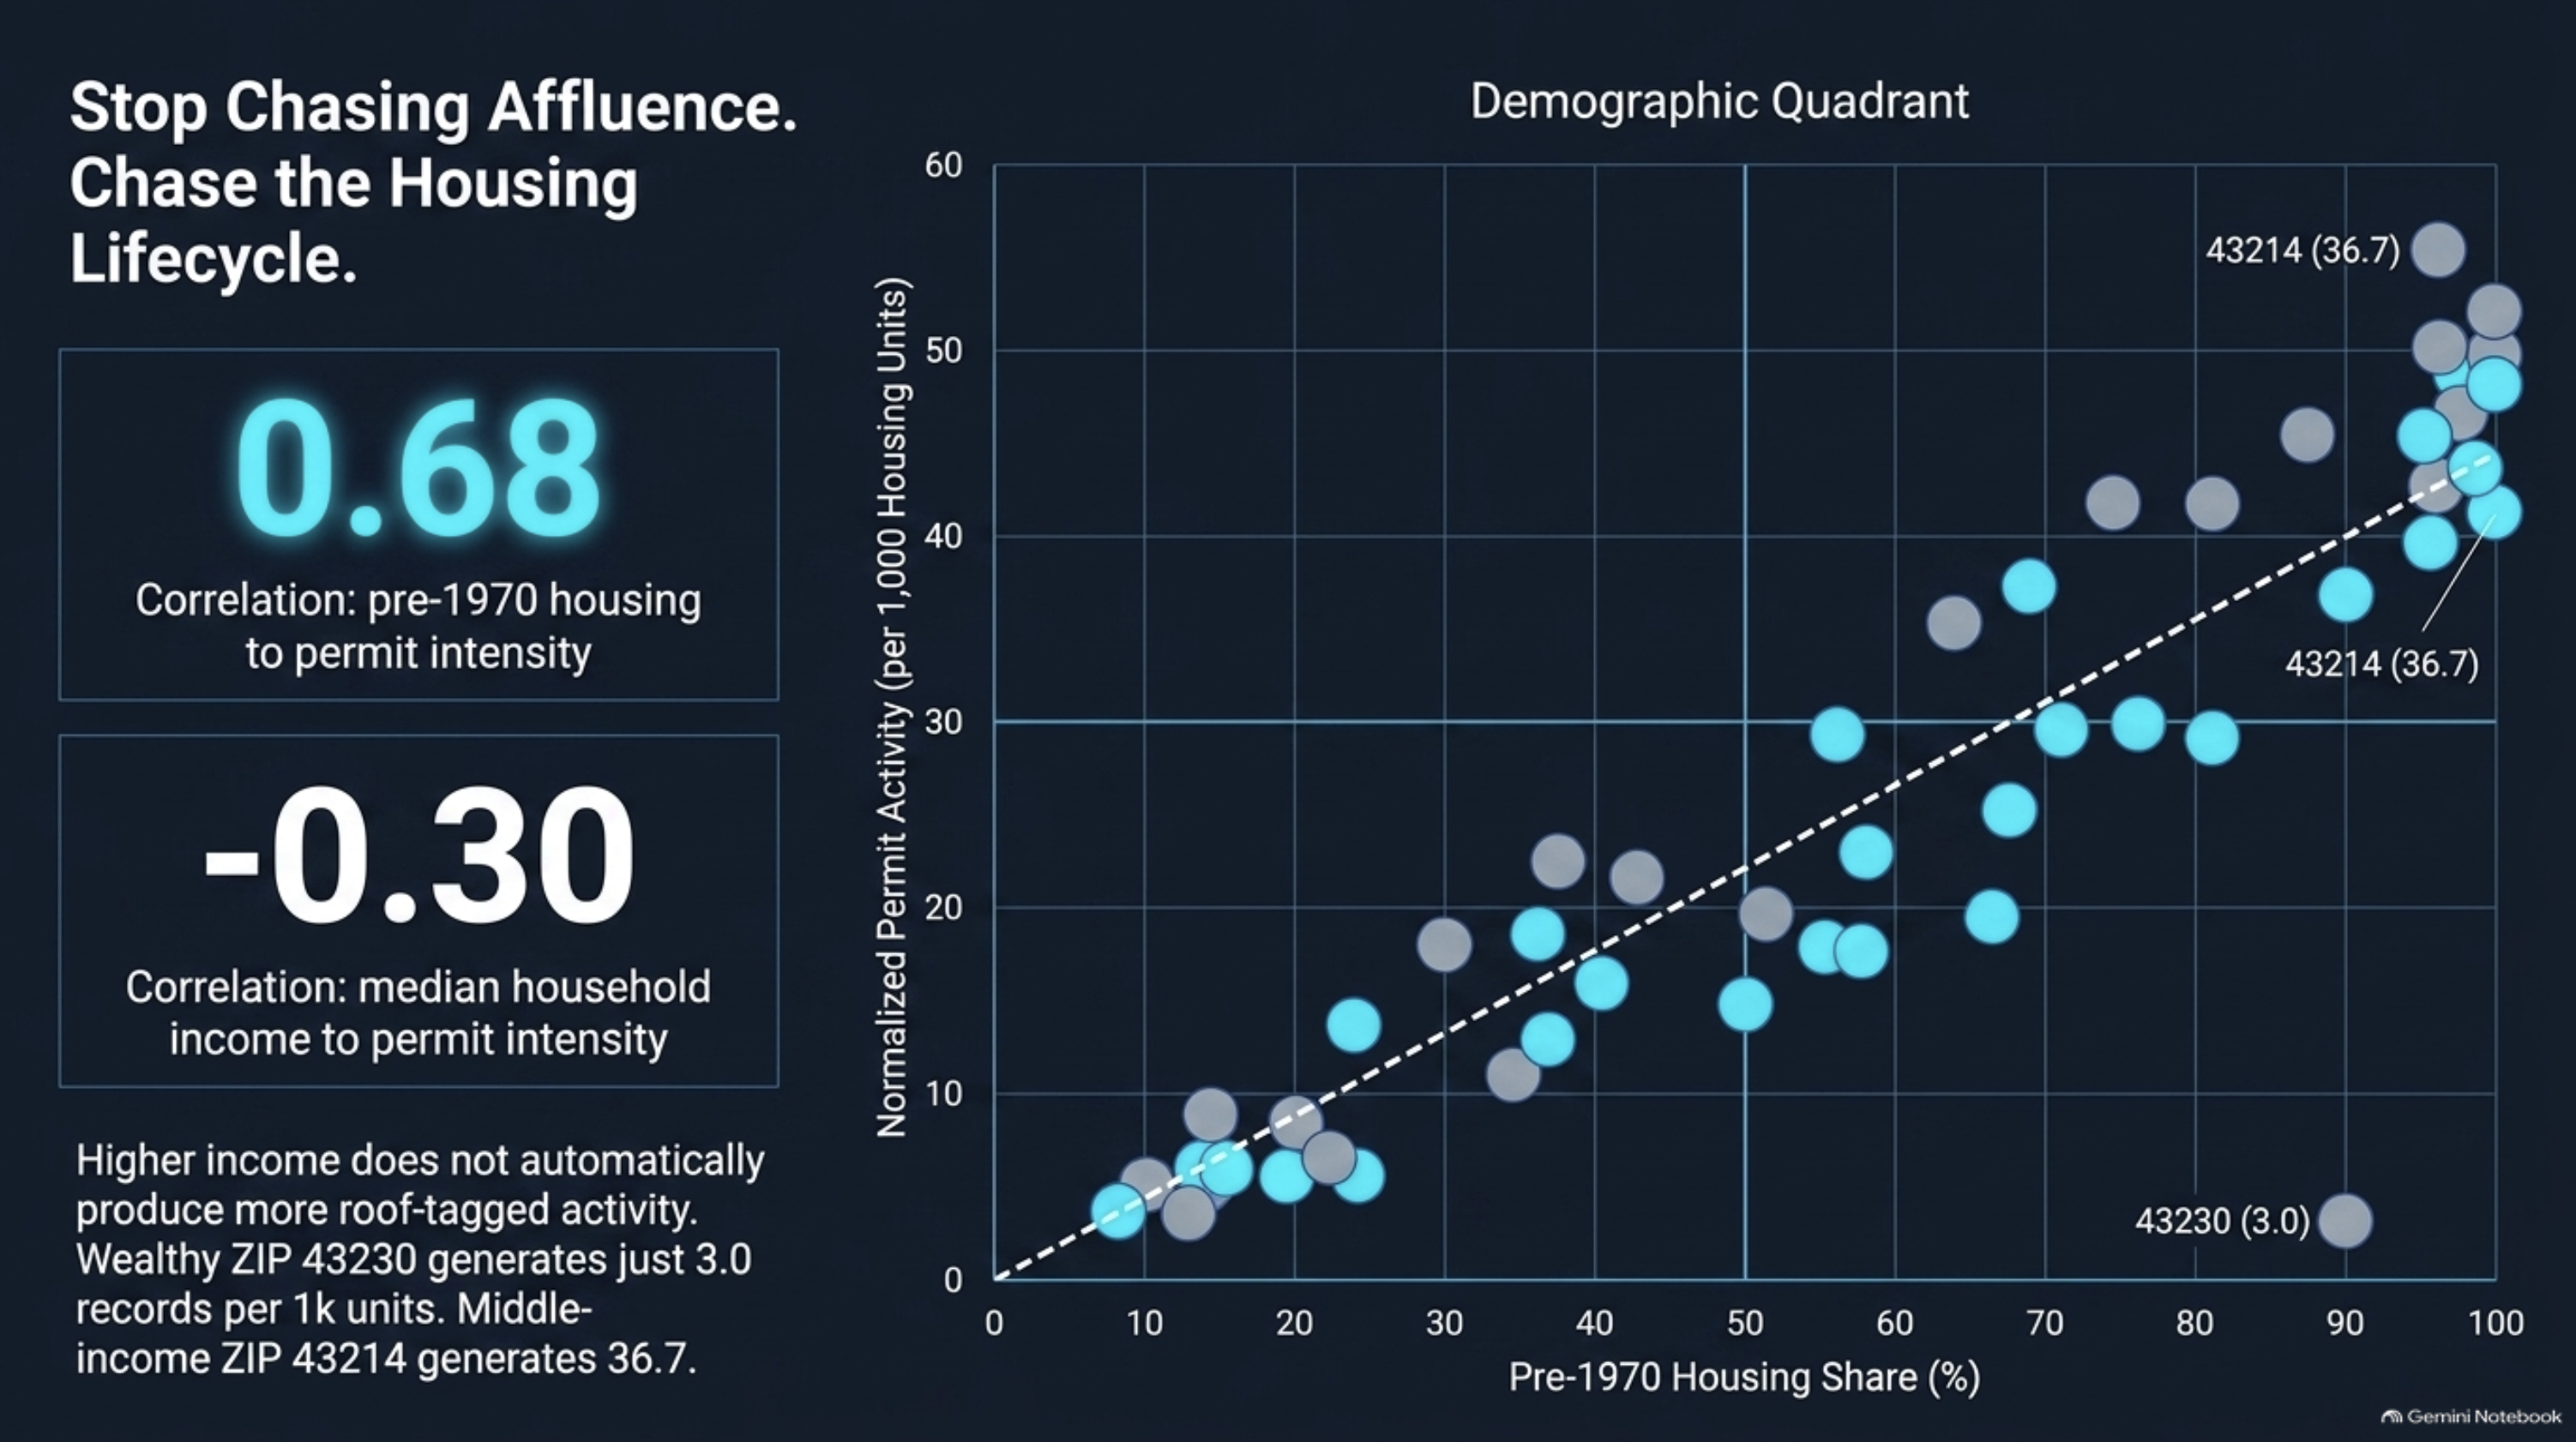
That number becomes even more interesting when you look at the characteristics of the housing stock. Many of the homes in this part of Columbus are older and more established, which helps explain why the area continues to produce strong roofing activity. It also reinforces one of the biggest takeaways from the analysis: older housing stock can be a better indicator of roofing opportunity than simply targeting the wealthiest neighborhoods.
It’s easy to assume that the highest-income areas or neighborhoods with the most expensive homes should automatically be the best roofing markets. But roofing doesn’t work quite that way. A homeowner in a $700,000 house doesn’t necessarily need a new roof, while someone living in a much less expensive home built several decades ago may be approaching another replacement cycle.
That is why we think housing age deserves more attention when roofing companies evaluate a market.
Older Homes Can Matter More Than Wealthier Homes
Roofing contractors already use a lot of demographic information when deciding where to market. Household income, home values, owner occupancy, and neighborhood demographics all have value, but none of those factors should be looked at in isolation.
Roofing is ultimately a need-based service. At some point, every roofing system reaches the end of its useful life, regardless of how much the homeowner earns or how expensive the property is. That means housing age can create strong replacement demand in neighborhoods that might otherwise be overlooked by contractors targeting only high-income ZIP codes.
When you start combining housing age with owner occupancy, historical roofing activity, current project volume, and projects per 1,000 housing units, the market begins to look very different. Instead of targeting an area because the residents appear wealthy, you can start targeting based on actual roofing demand.
That is a much stronger foundation for a roofing marketing strategy.
Why Housing Age Matters in Columbus
Columbus is an interesting market because it has a wide mix of housing stock. There are established neighborhoods with homes built many decades ago, rapidly growing suburbs with newer construction, and developing areas where thousands of homes have been added more recently. Those areas are not going to behave the same way from a roofing perspective.
New construction can generate plenty of roofing activity, but replacement roofing is driven by different factors. Roof age, storm damage, deferred maintenance, home sales, renovation cycles, insurance events, and normal deterioration all influence when a homeowner decides to replace a roof.
That’s why combining roofing project data with housing data can tell you significantly more than project counts alone. A ZIP code with a large number of older, owner-occupied homes and consistently high roofing activity may present a stronger long-term opportunity than a newer and wealthier part of the city.
Then We Looked at the Contractors
This was probably one of the more interesting parts of the analysis. Knowing that the Columbus roofing market is growing is useful, but it becomes much more valuable when you understand who is actually capturing that growth.
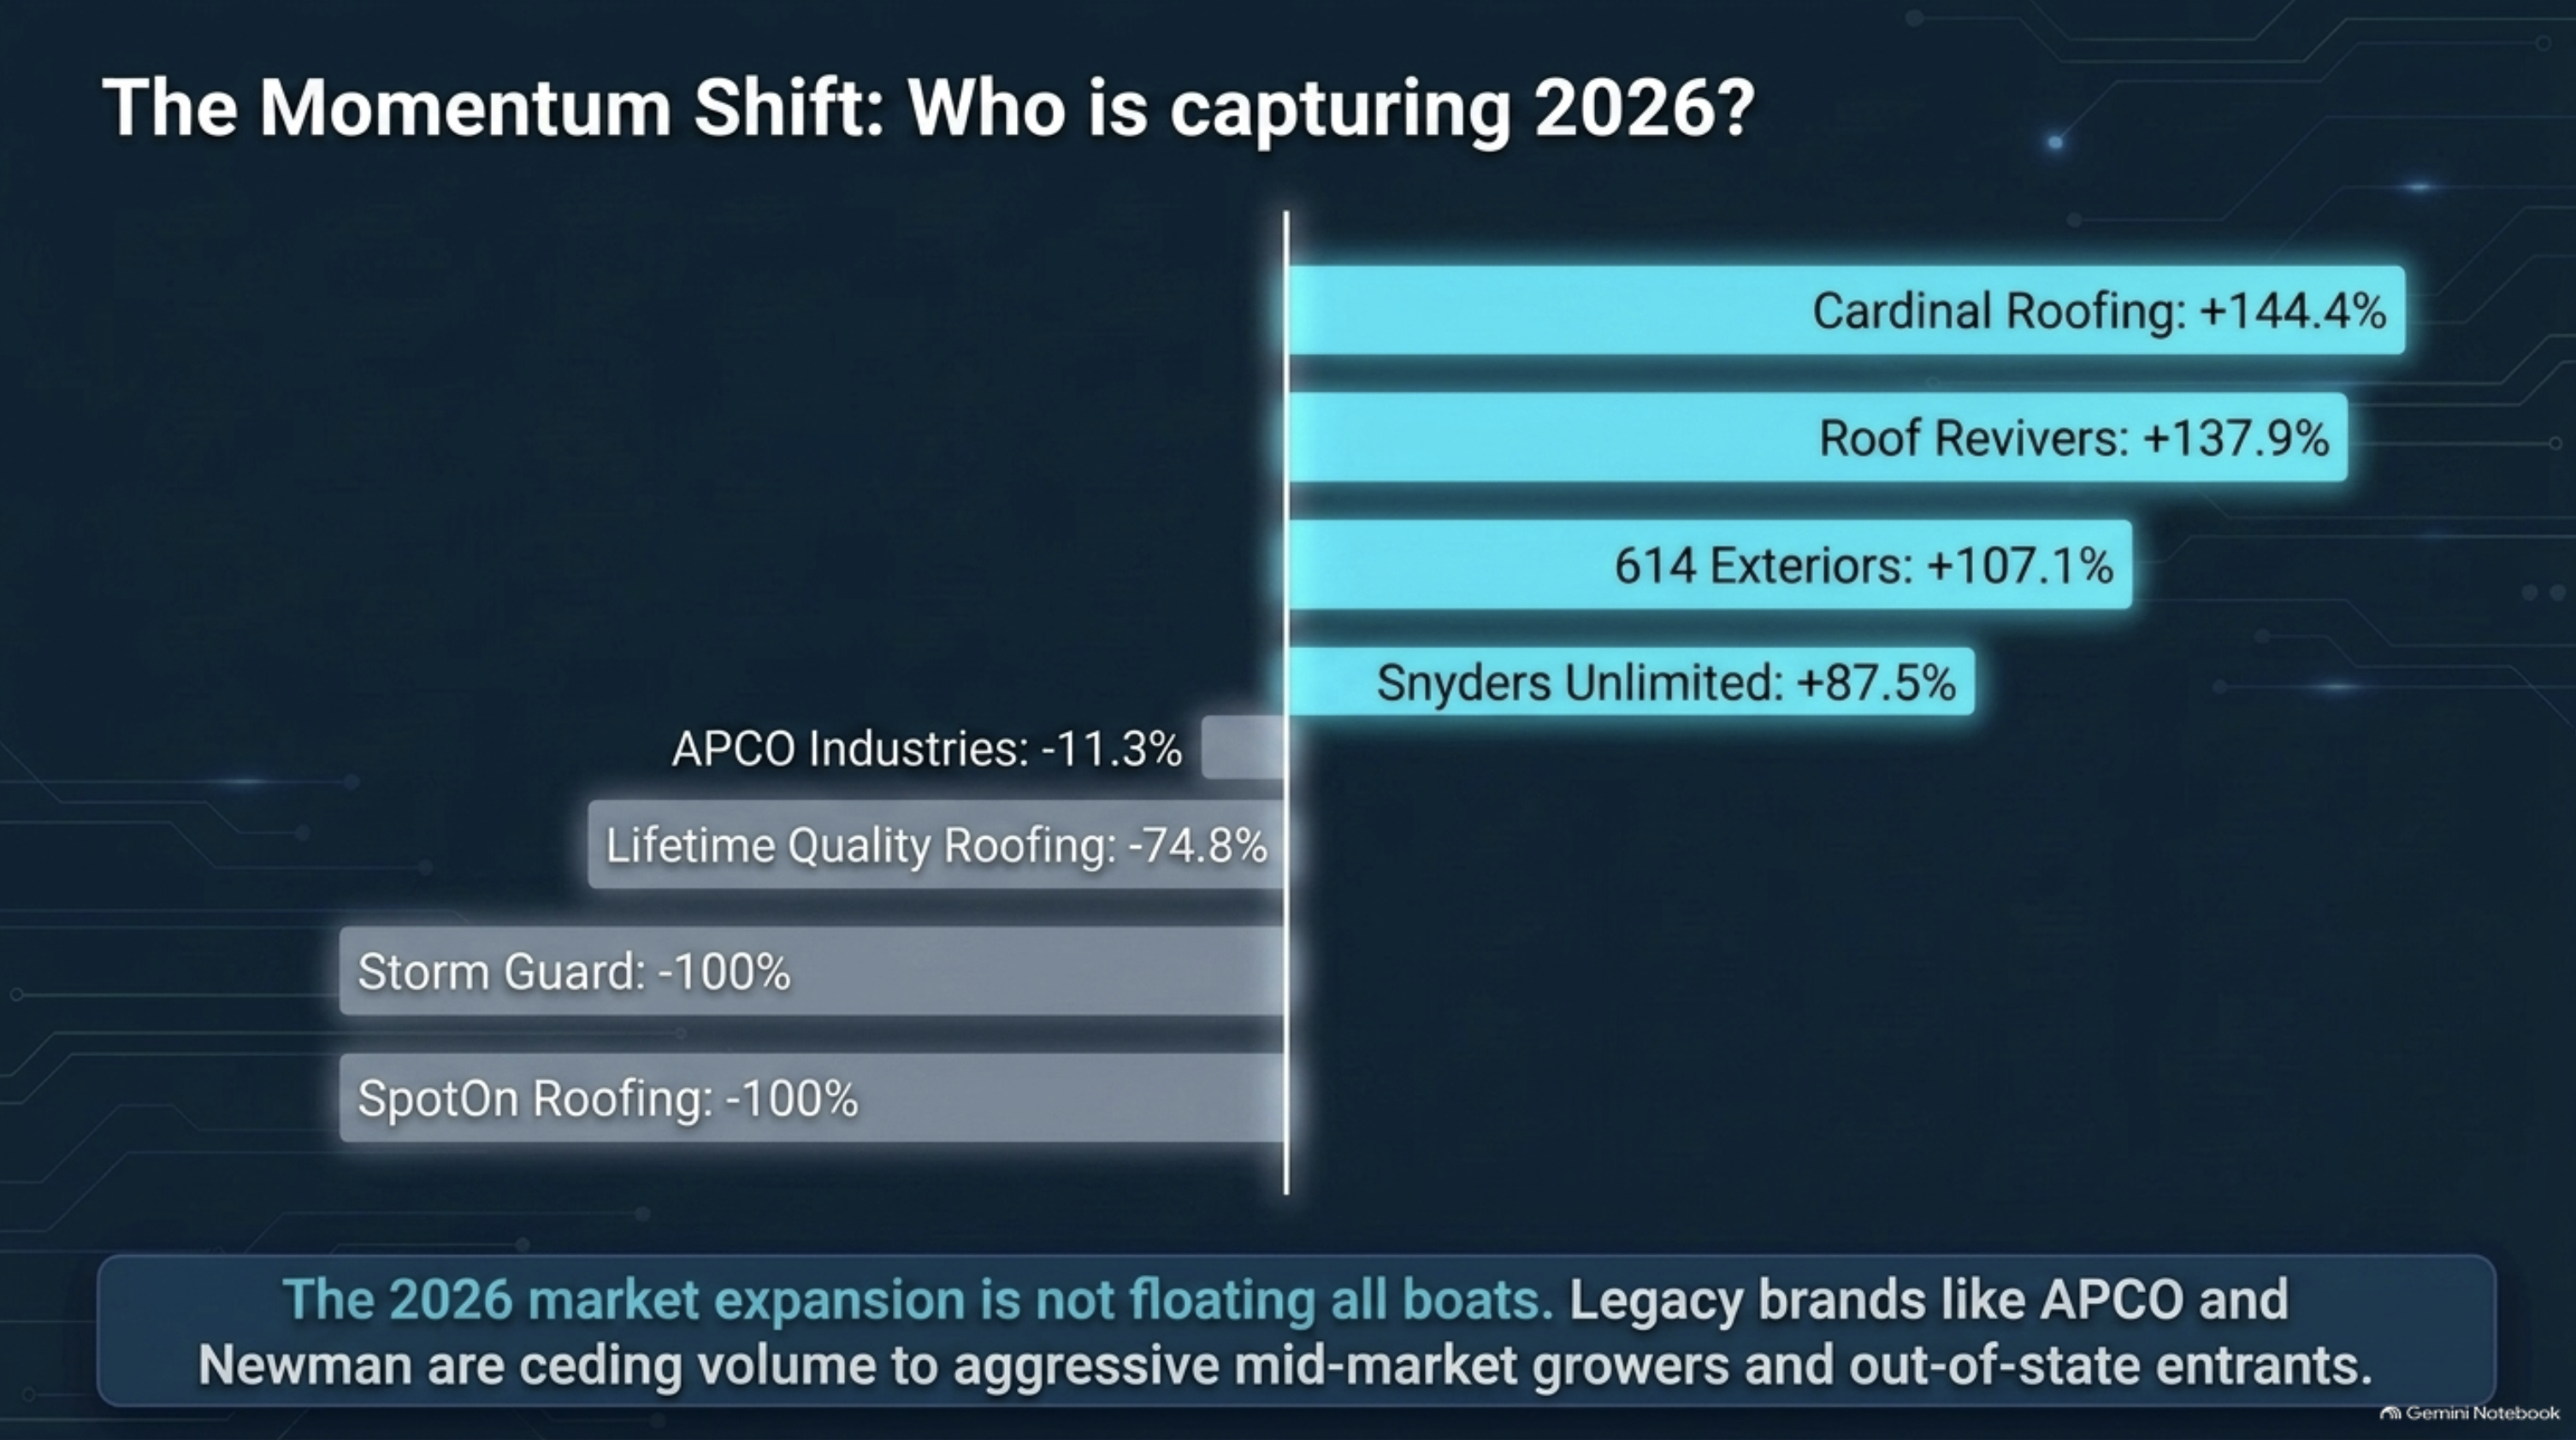
Market growth does not automatically mean every roofing company in Columbus is growing at the same rate. In fact, one large contractor can have enough activity to noticeably influence the overall numbers. That is exactly what we saw when we looked at the contractor data.
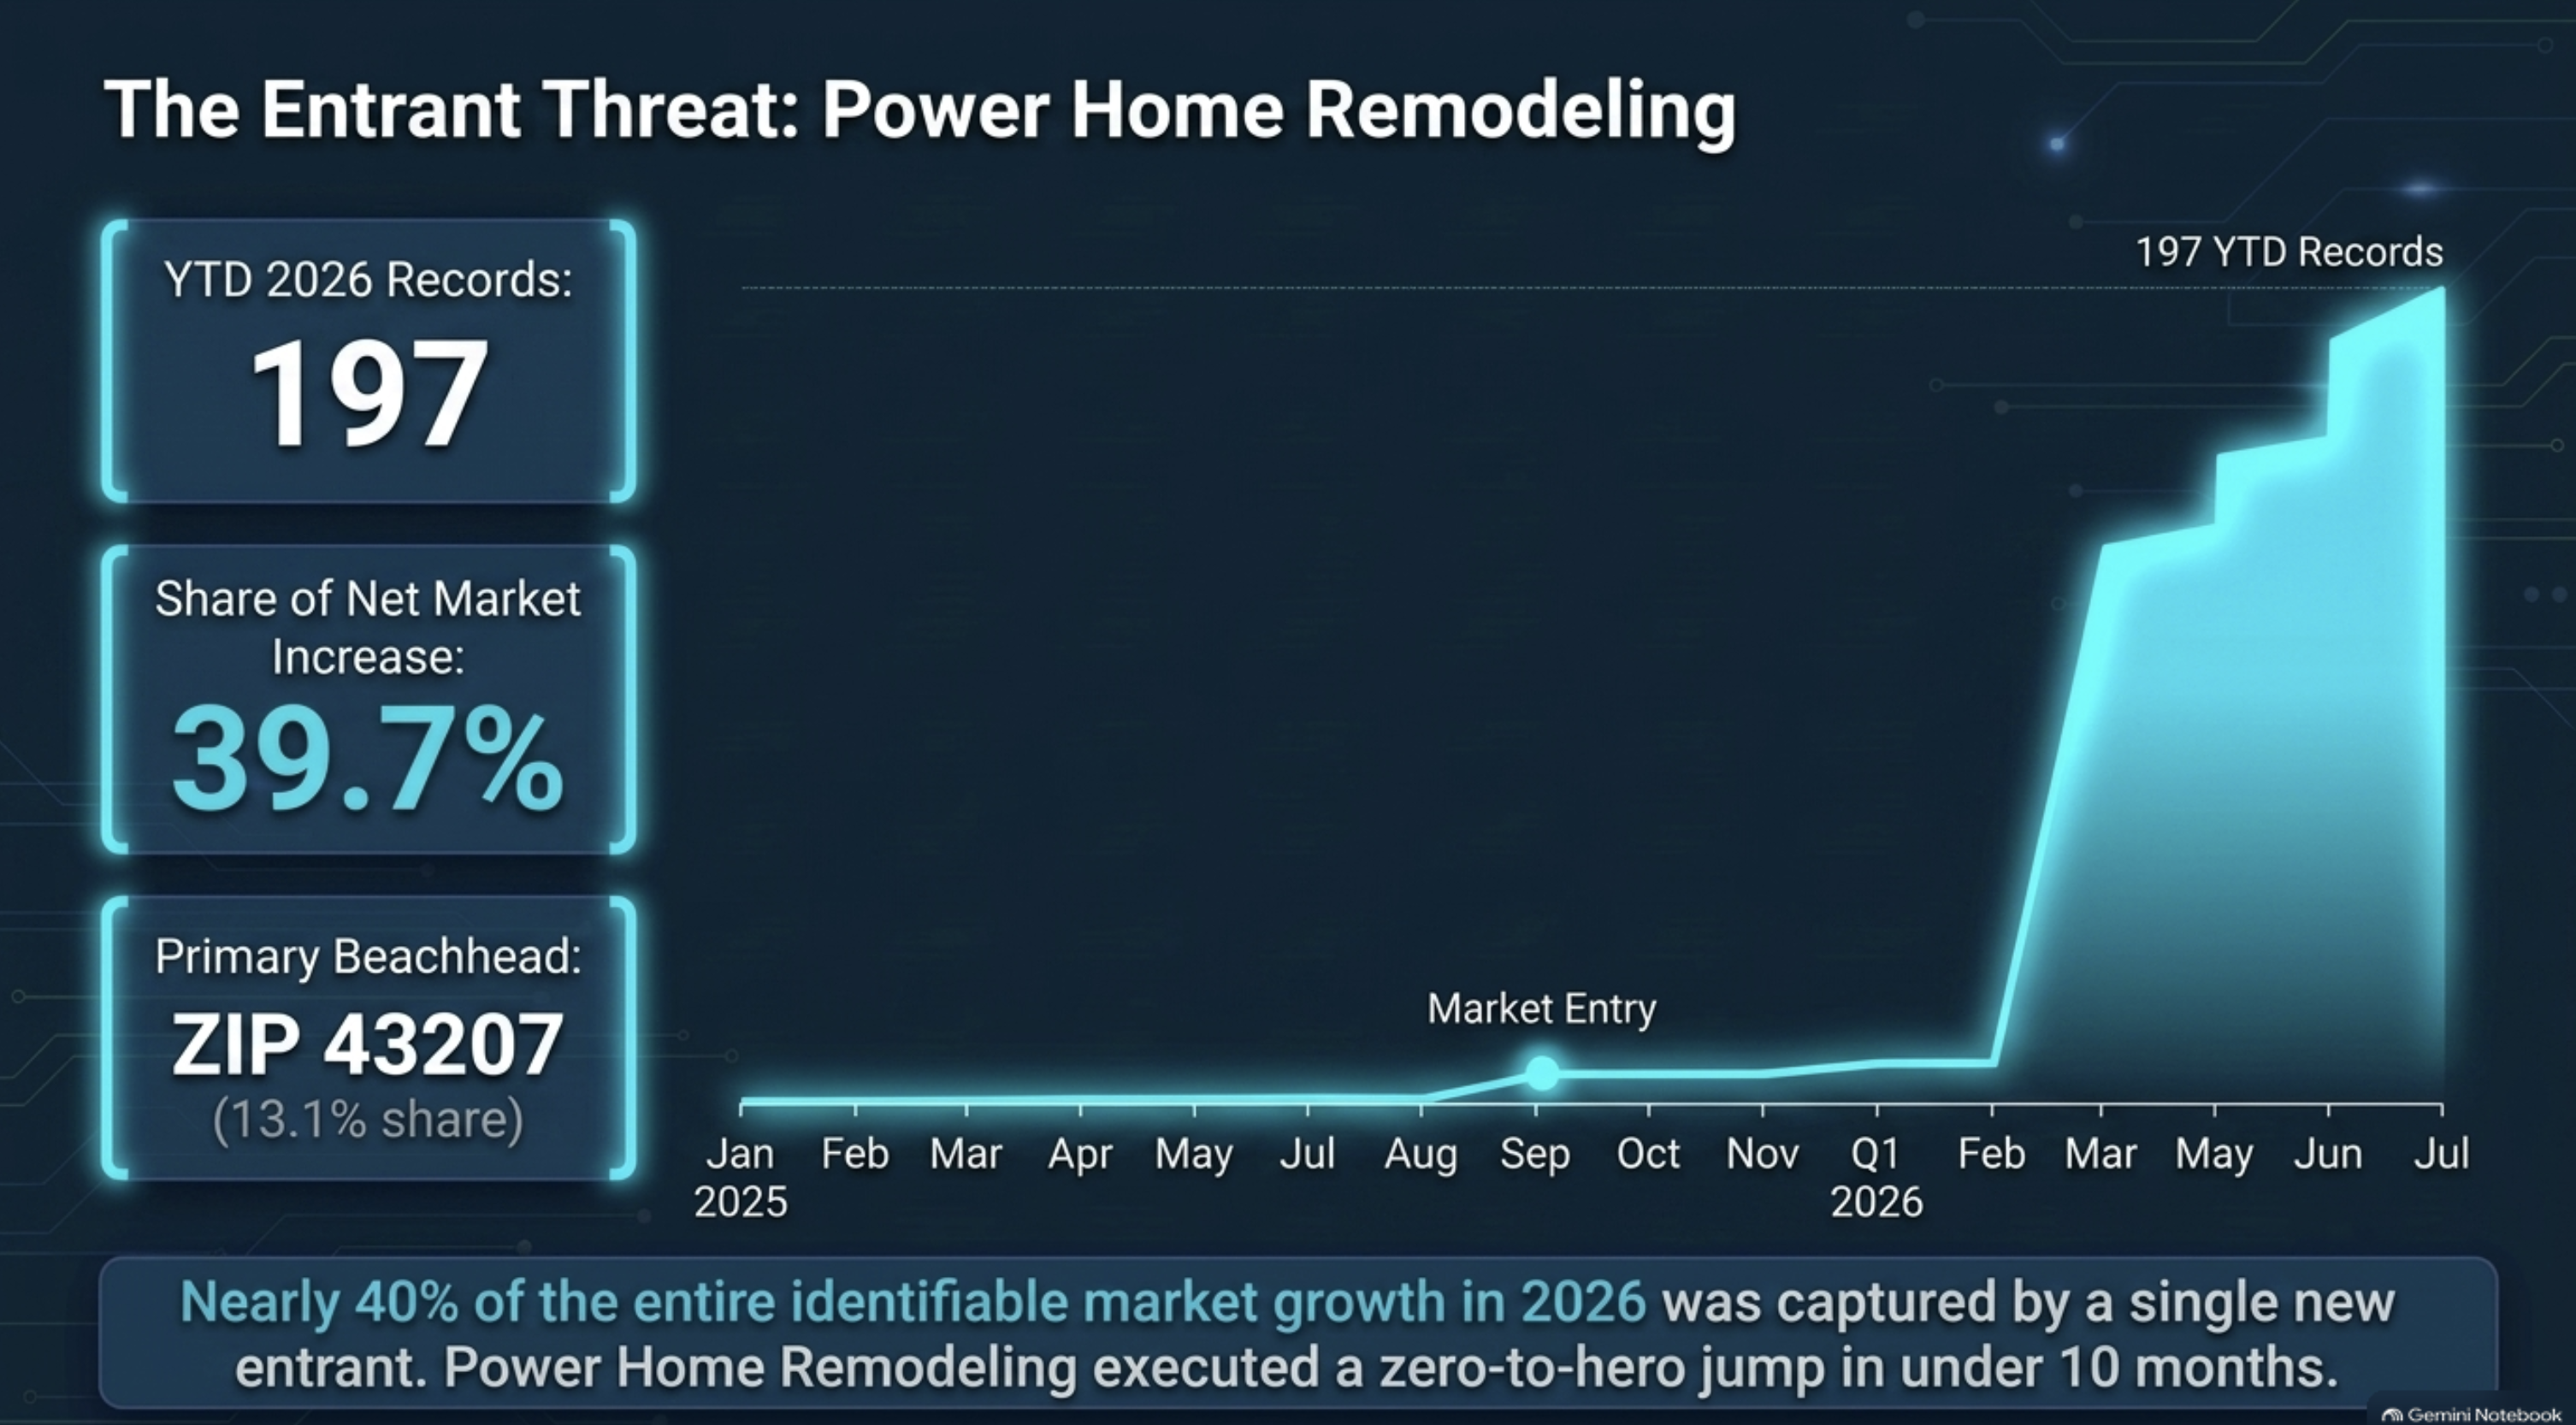
Power Home Remodeling showed enough activity that it materially affected what we were seeing in the Columbus market. That matters because a contractor looking only at the headline growth number could draw the wrong conclusion.
If you see that Columbus roofing activity is up 20.6%, you might immediately think the market is exploding and decide it is time to add another crew, increase advertising, or expand hiring. Those decisions might be correct, but you would probably want to know first whether that growth is broad-based or whether a meaningful portion of it is being driven by one large company dramatically increasing production.
That is a very different situation.
Market Growth and Market Share Are Not the Same Thing
This is one of the areas where I think roofing companies should pay much closer attention. Your company can grow while still losing market share.
Let’s say total roofing activity in your territory increases by 20%, but your company only grows by 5%. Your revenue may be up, your production may be up, and internally things may look positive. But relative to the rest of the market, you actually lost ground.
The opposite can also happen. If the overall market stays flat and your company grows 15%, you are taking market share even though the market itself is not expanding.
Those two situations require completely different strategies, but you may never recognize the difference if you only look at the information inside your CRM.
Your CRM tells you what is happening inside your company. Market intelligence tells you what is happening around it. For roofing contractors, I think you really need both.
Your CRM Only Shows Half the Picture
Most established roofing companies already track a lot of information. They know how many leads they generate, how many appointments are set, their close rate, average contract value, sales rep performance, cost per lead, marketing spend, and customer acquisition cost. Those are all important numbers and every contractor should know them.
The problem is that your CRM cannot tell you what happened to all of the jobs you didn’t get. It doesn’t tell you if a competitor suddenly doubled production in one of your strongest ZIP codes. It doesn’t tell you if total roofing activity increased while your company stayed flat, and it doesn’t tell you if a neighborhood a few miles away is quietly producing significantly more roofing work than it was six months ago.
That’s the blind spot we’re trying to help contractors see with ContraX.
Think of the Market Like a Battle Map
I’ve used this comparison before because I think it explains the concept pretty well. Think of your roofing market like a battle map. Obviously, we’re not actually going to war with the roofing company down the street, although if you spend enough time in roofing Facebook groups, sometimes it might feel that way.
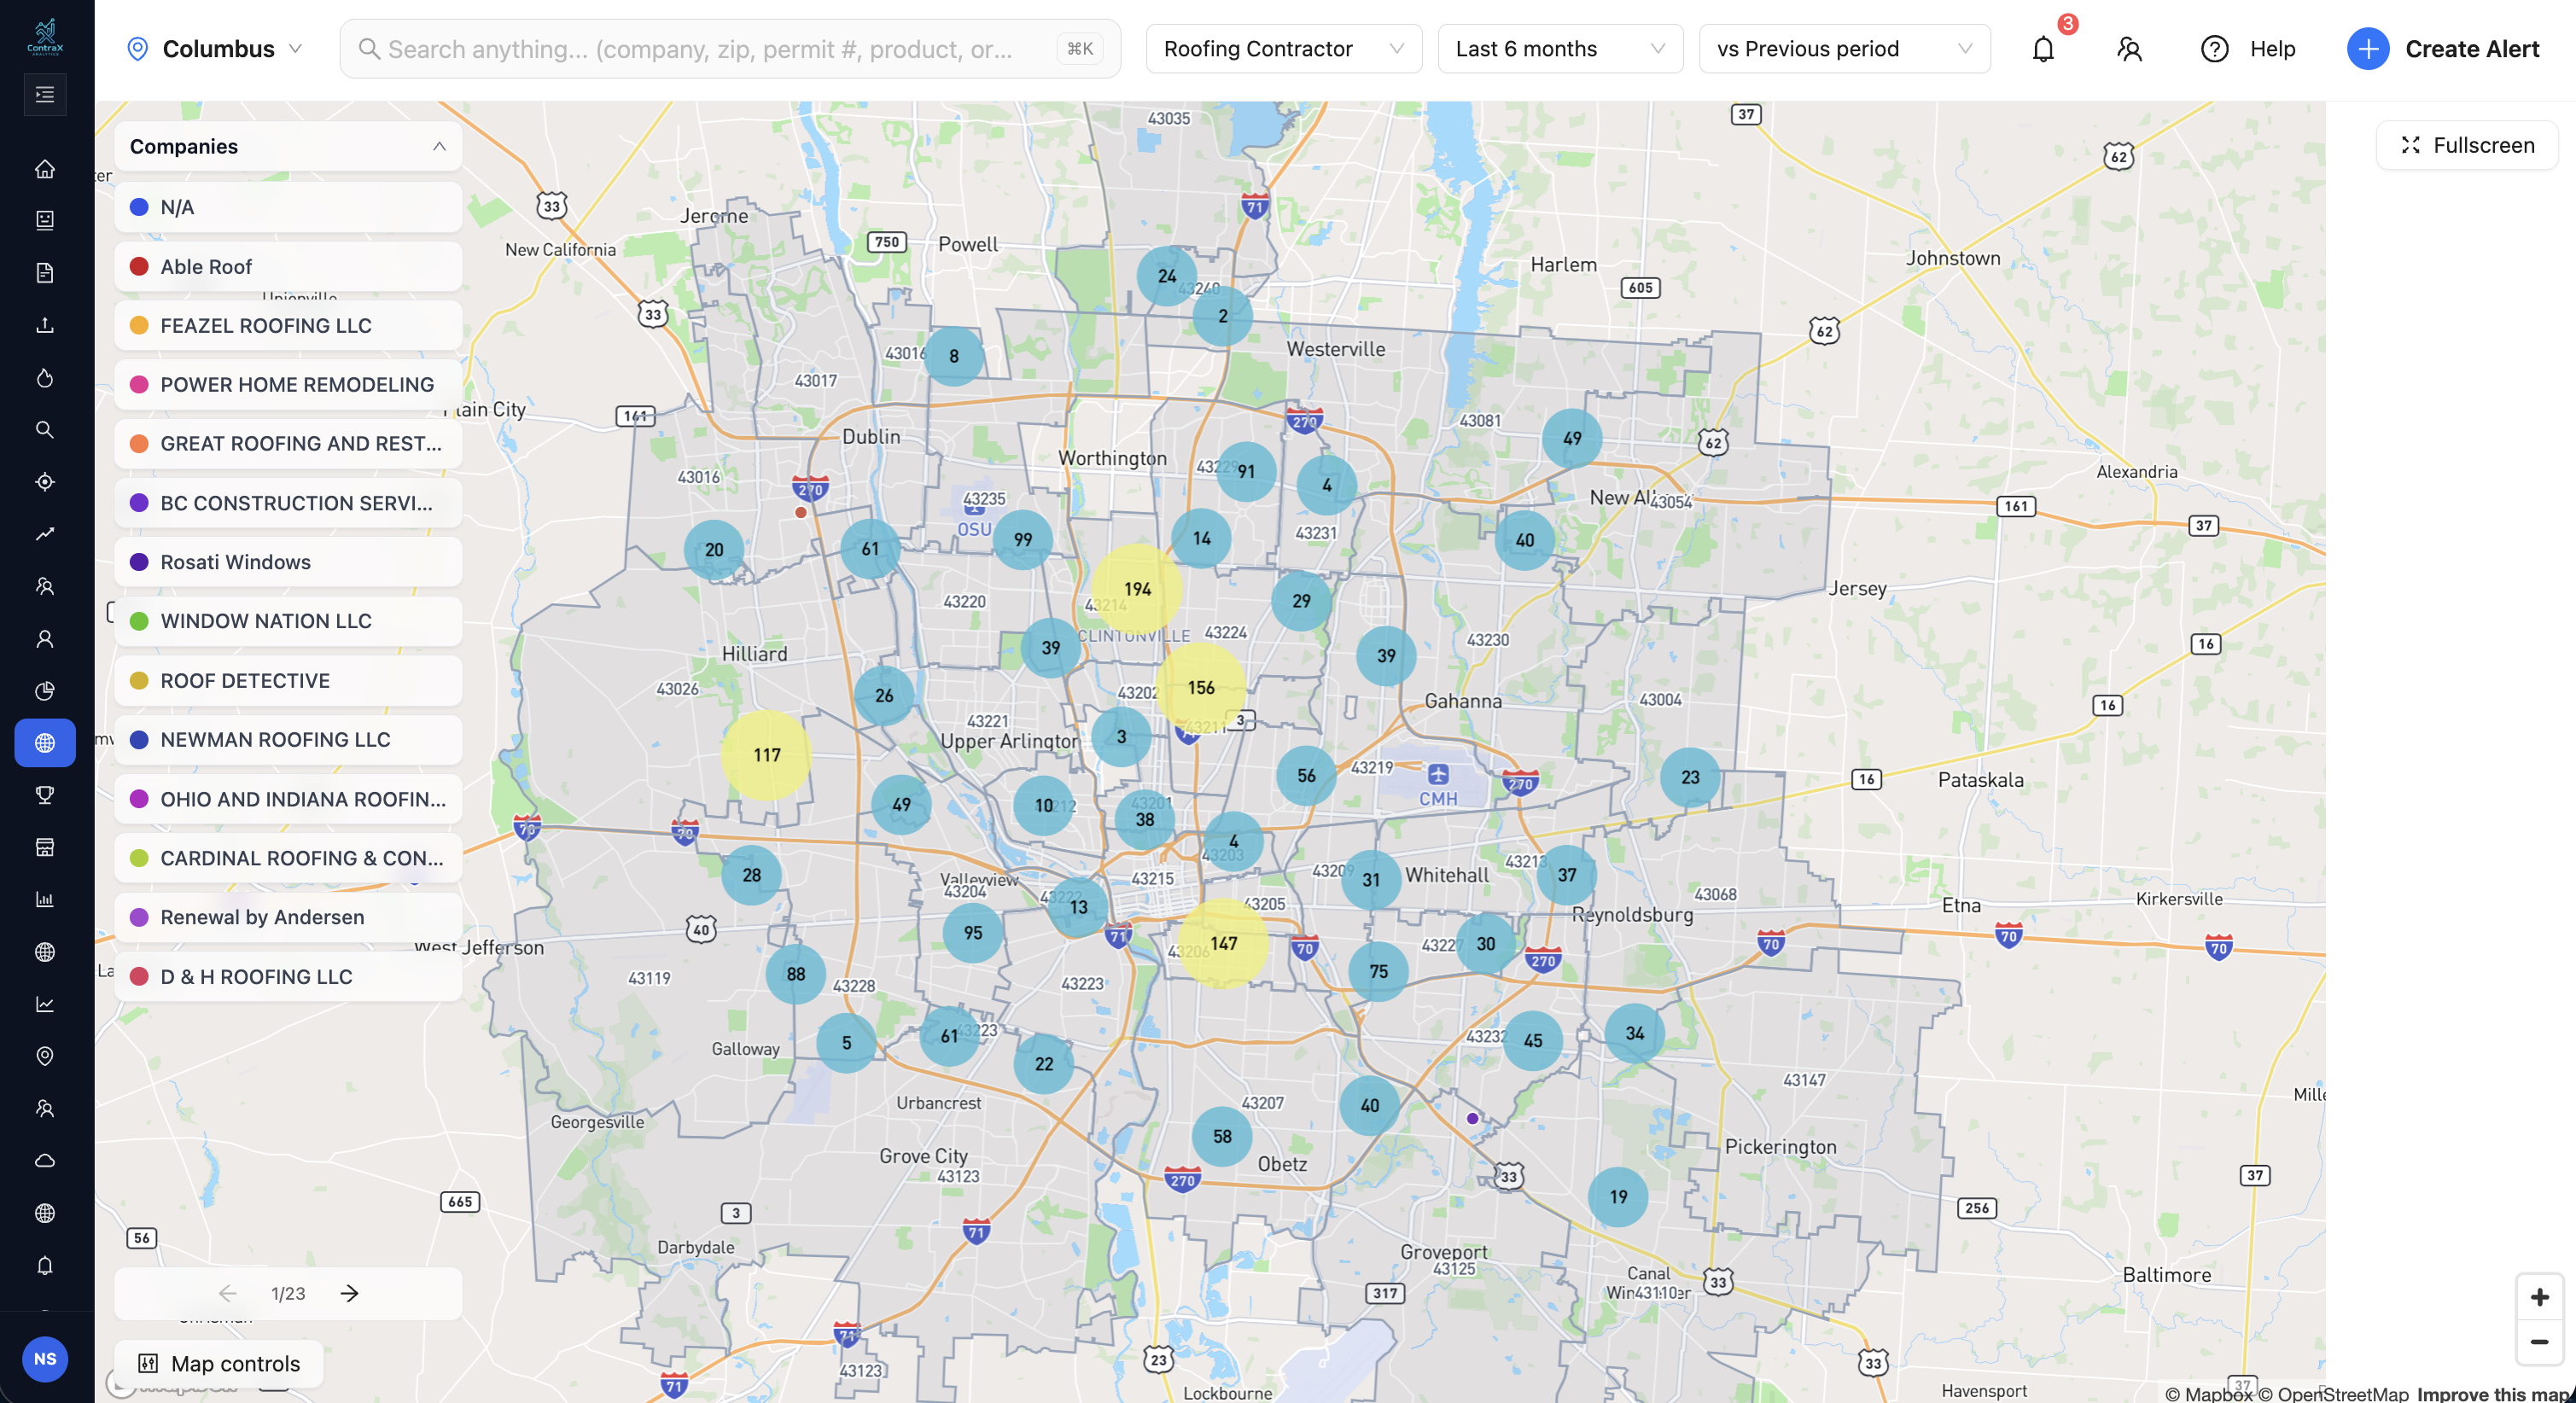
The point is that you should have some level of situational awareness about what is happening around you. You should know where the opportunities are, where activity is increasing, where competitors are concentrated, where your company is strong, and where you may be losing ground.
That information isn’t useful because data itself is interesting. It’s useful because it helps answer real business questions.
Should You Hire Another Roofing Crew?
If roofing activity in Columbus suddenly jumps, should you hire another crew? Maybe, but I would want to know more first.
Is the increase happening consistently over several months? Is it occurring throughout the Columbus market or only in a handful of ZIP codes? Is one contractor responsible for a disproportionate amount of the growth? Was there a storm or another event that temporarily increased demand? Is replacement activity genuinely trending upward?
Those questions matter because adding payroll, trucks, equipment, and overhead based on a temporary spike can become expensive very quickly.
A strong month is activity. A strong quarter might be a pattern. Several quarters or years begin to look like a real trend.
That historical context matters.
Should You Spend More on Roofing Marketing?
The same logic applies to marketing. If I’m going to spend another $10,000 or $20,000 trying to grow a roofing company in Columbus, I want to understand where that money has the best chance of producing a return.
Traditionally, a contractor might target the ZIP codes with the highest household incomes, the highest home values, or the largest number of homeowners. Those are reasonable starting points, but they don’t necessarily tell you where roofing demand is strongest.
I would rather know where roofing activity is increasing, which ZIP codes are producing the most projects per 1,000 housing units, where older housing stock is entering replacement cycles, which competitors are gaining market share, and where there may be opportunities that other roofing companies are overlooking.
That gives you a much better starting point for deciding where to spend your marketing dollars.
A Strong Quarter Does Not Automatically Mean a New Normal
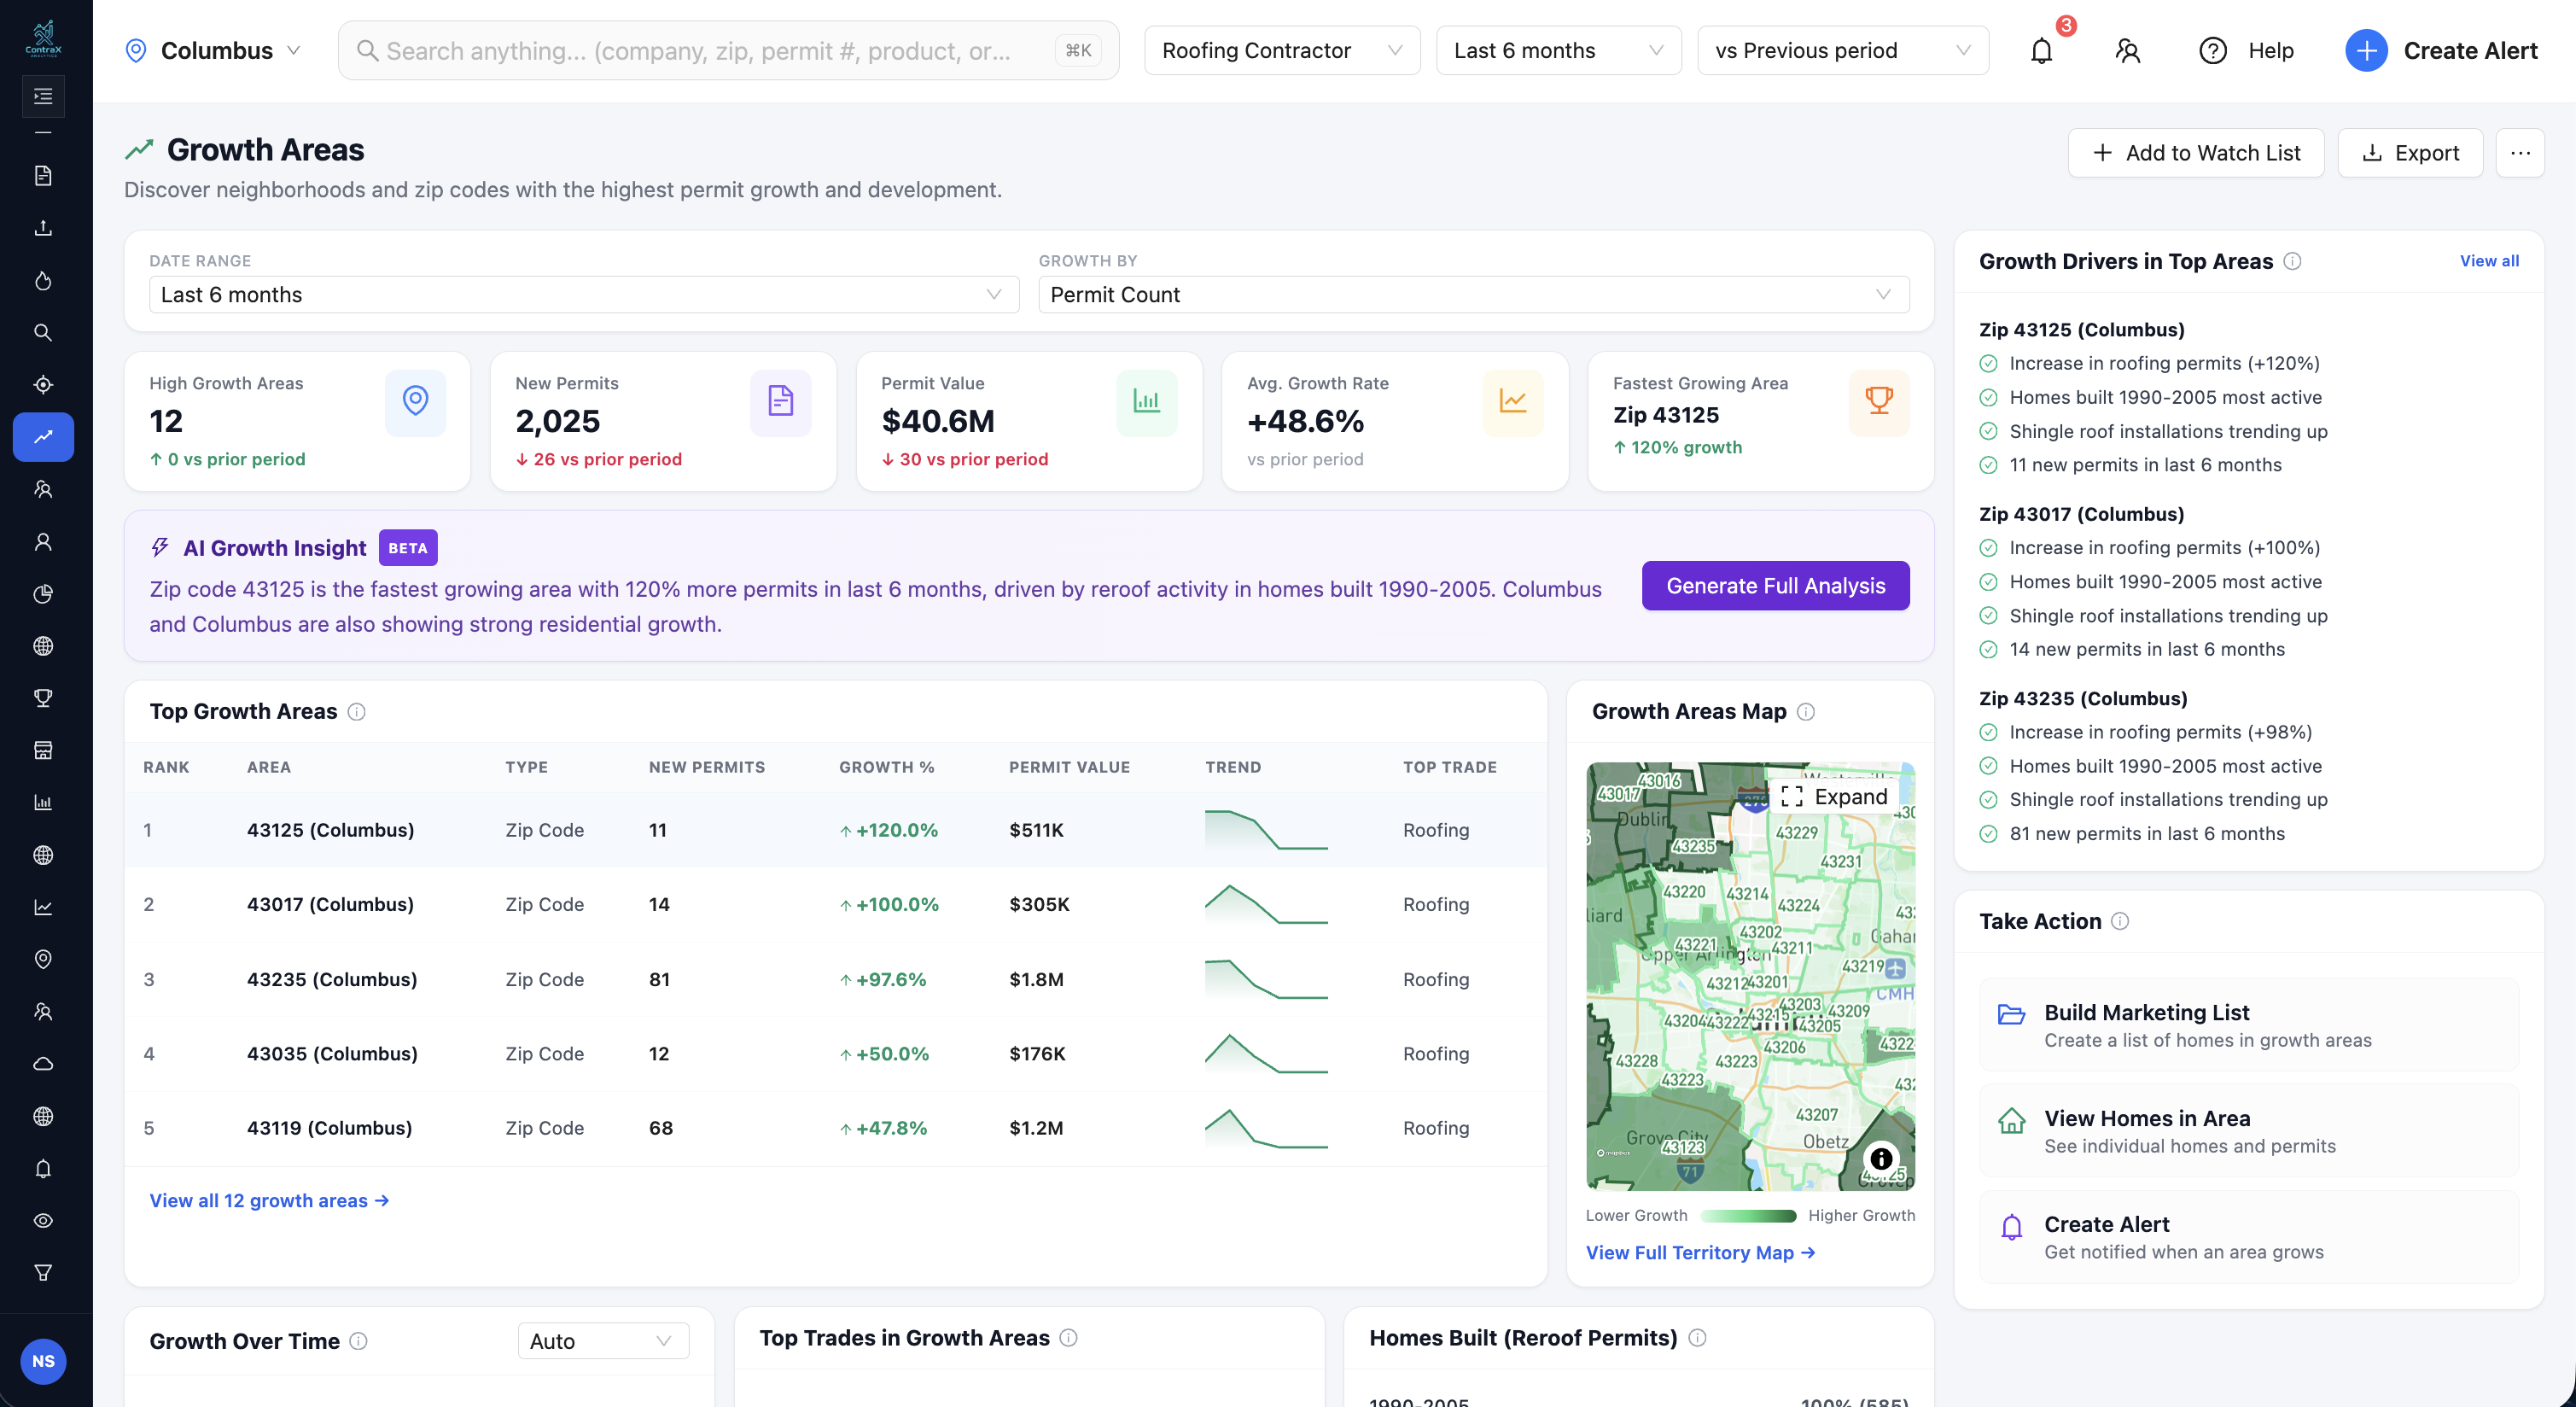
Another thing we noticed in the Columbus roofing data was a noticeable increase during Q2. That can be exciting, but it is also where businesses can get themselves into trouble if they assume short-term growth will continue indefinitely.
A strong quarter can happen for a lot of reasons. Seasonality, weather, contractor activity, delayed projects, insurance claims, or changes in permitting volume can all influence short-term numbers. Before making major decisions around staffing, fleet size, marketing, or expansion, I want to understand whether the increase is part of a larger trend or just a temporary surge.
That is why looking at multiple years of roofing data is so important. The longer the trend continues, the more confidence you can have that something meaningful is changing in the market.

What Does the Columbus Roofing Data Actually Tell Us?
The biggest takeaway is that Columbus remains an active roofing market and recent activity has increased significantly, but the opportunity is not evenly distributed across the city.
Certain ZIP codes are clearly producing stronger concentrations of roofing activity than others. ZIP code 43214 is a good example, with approximately 36.7 roofing projects per 1,000 housing units in our analysis. The housing data also suggests that older neighborhoods can remain extremely strong roofing markets even when they are not the wealthiest areas in Columbus.
At the same time, contractor-level data shows why you cannot assume market growth is being shared equally. Large companies such as Power Home Remodeling can generate enough activity to noticeably influence the overall market, which makes competitive analysis just as important as understanding total project volume.
When you combine those pieces, you start getting a much clearer picture of what is actually happening.
From Roofing Data to Better Decisions
At ContraX, we’re not really interested in giving roofing contractors another giant spreadsheet. There are already plenty of spreadsheets in the world.
What matters is what you can actually do with the information.
Maybe the data tells you to increase marketing in one ZIP code and pull back in another. Maybe it tells you that now isn’t the right time to hire another crew. Maybe you discover a neighborhood your competitors have overlooked, or you realize that your revenue is growing while your market share is falling.
You might even find that the market isn’t slowing down at all. Your company just isn’t capturing as much of it as it used to.
Those are the kinds of insights we care about because they can actually influence how a roofing company operates.

Better Data. Better Decisions.
The headline from our Columbus analysis is simple: roofing activity increased 20.6%. But the headline alone doesn’t tell you enough.
The real value comes from understanding where that growth occurred, what types of neighborhoods are producing demand, which contractors are capturing the work, and whether the trend is likely to continue.
That’s the difference between simply having data and actually understanding your market.
For roofing contractors trying to decide where to market, where to hire, where to expand, and where to compete, that difference matters.
Because ultimately, more data isn’t the goal.
Better decisions are.
Better Data. Better Decisions.