
How contractors can use permit data, Census demographics, and market intelligence to make smarter decisions.
What if the busiest ZIP code in your market wasn't actually the most active?
That's one of the interesting findings from our latest ContraX Market Deep Dive, where we analyzed nearly 59,000 building permit records from Buffalo, New York.
We examined roofing, heating, and electrical permit activity from October 2021 through October 2026, looking at industry trends, contractor activity, and geographic differences. We also incorporated U.S. Census American Community Survey (ACS) housing estimates to better understand how permit volume compares with the size of each market.
The results highlight something every contractor should understand: More permits don't automatically mean more opportunity.
Buffalo’s Electrical Permit Activity Is Growing
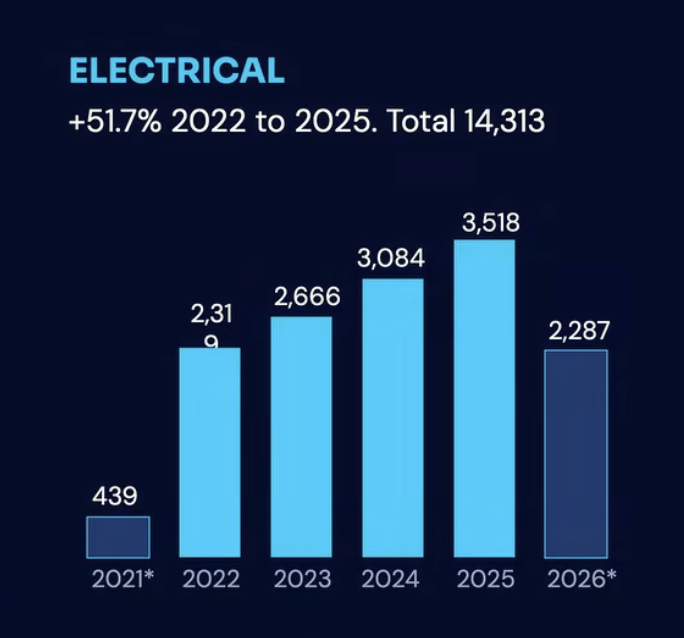
One of the clearest trends in the data comes from electrical permits.
In 2022, Buffalo recorded 2,319 electrical permits. By 2025, that number had climbed to 3,518.
That's a 51.7% increase in just three years.
For electrical contractors, this is worth paying attention to. Increased permit activity can reflect changes in construction, renovation, equipment upgrades, and other permitted electrical work.
But there's an important distinction.
More permits don't necessarily translate into more revenue, higher profit margins, or greater unmet demand. A market could experience rising permit activity while becoming increasingly competitive.
The real opportunity comes from understanding where activity is increasing, which contractors are participating, and whether your business is positioned to compete effectively.
That's where historical permit analysis becomes valuable.
Roofing Activity Tells a Different Story
Buffalo's roofing market followed a different trajectory.
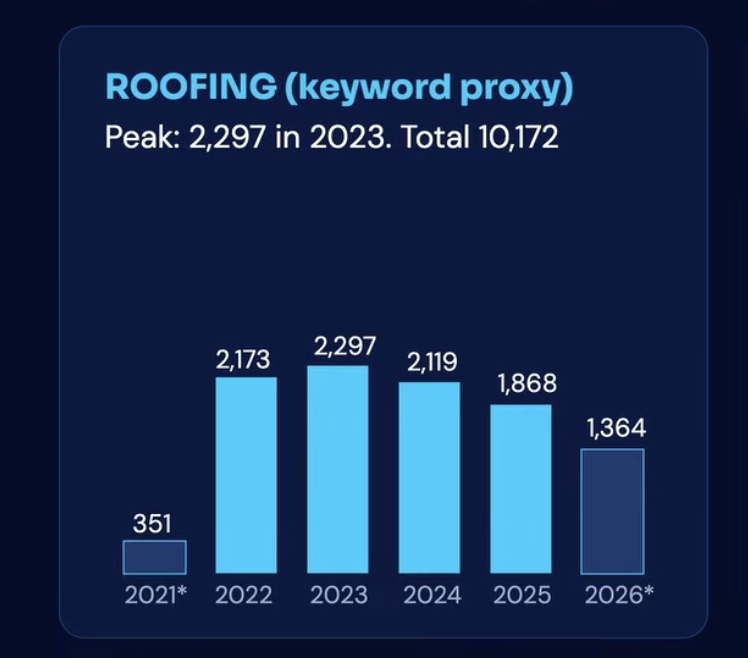
Our analysis identified approximately 2,173 roofing-related permits in 2022, increasing to 2,297 in 2023.
Activity subsequently declined to 2,119 in 2024 and 1,868 in 2025.
That's approximately a 19% decline from the 2023 peak to 2025.
Does that mean Buffalo's roofing market is struggling?
Not necessarily.
Permit counts alone cannot explain why activity changes. Weather, project timing, economic conditions, permitting practices, and other factors may influence the numbers.
However, these changes should prompt roofing contractors to ask better questions.
Are certain neighborhoods experiencing stronger activity than others? Are established competitors maintaining their permit volume? Is the decline widespread, or concentrated in particular ZIP codes?
Instead of assuming the entire market is moving in one direction, contractors can investigate where activity is holding steady and where it's changing.
HVAC: Understanding Heating Permit Activity
Buffalo's heating permits tell another interesting story.
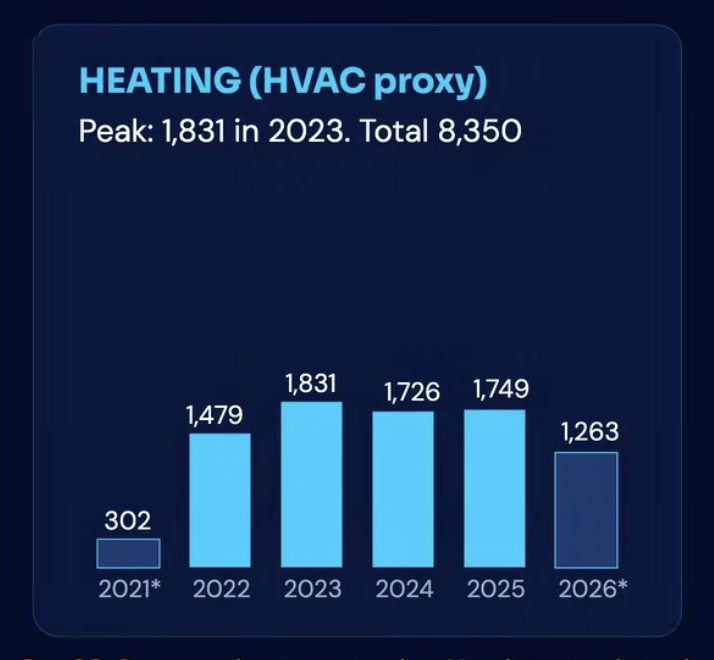
We identified 1,479 heating permits in 2022, followed by 1,831 in 2023, 1,726 in 2024, and 1,749 in 2025.
Unlike electrical permits, which showed sustained annual growth, heating activity remained relatively stable after its 2023 increase.
For HVAC contractors, that difference matters.
It's also important to recognize that heating permits are only a proxy for HVAC activity. They don't capture every air-conditioning installation, maintenance visit, or service opportunity.
Even with that limitation, permit trends can help contractors understand the geographic distribution of permitted equipment-related work.
The ZIP Code Surprise: Why Raw Permit Counts Can Mislead
Here's where the analysis gets particularly interesting.
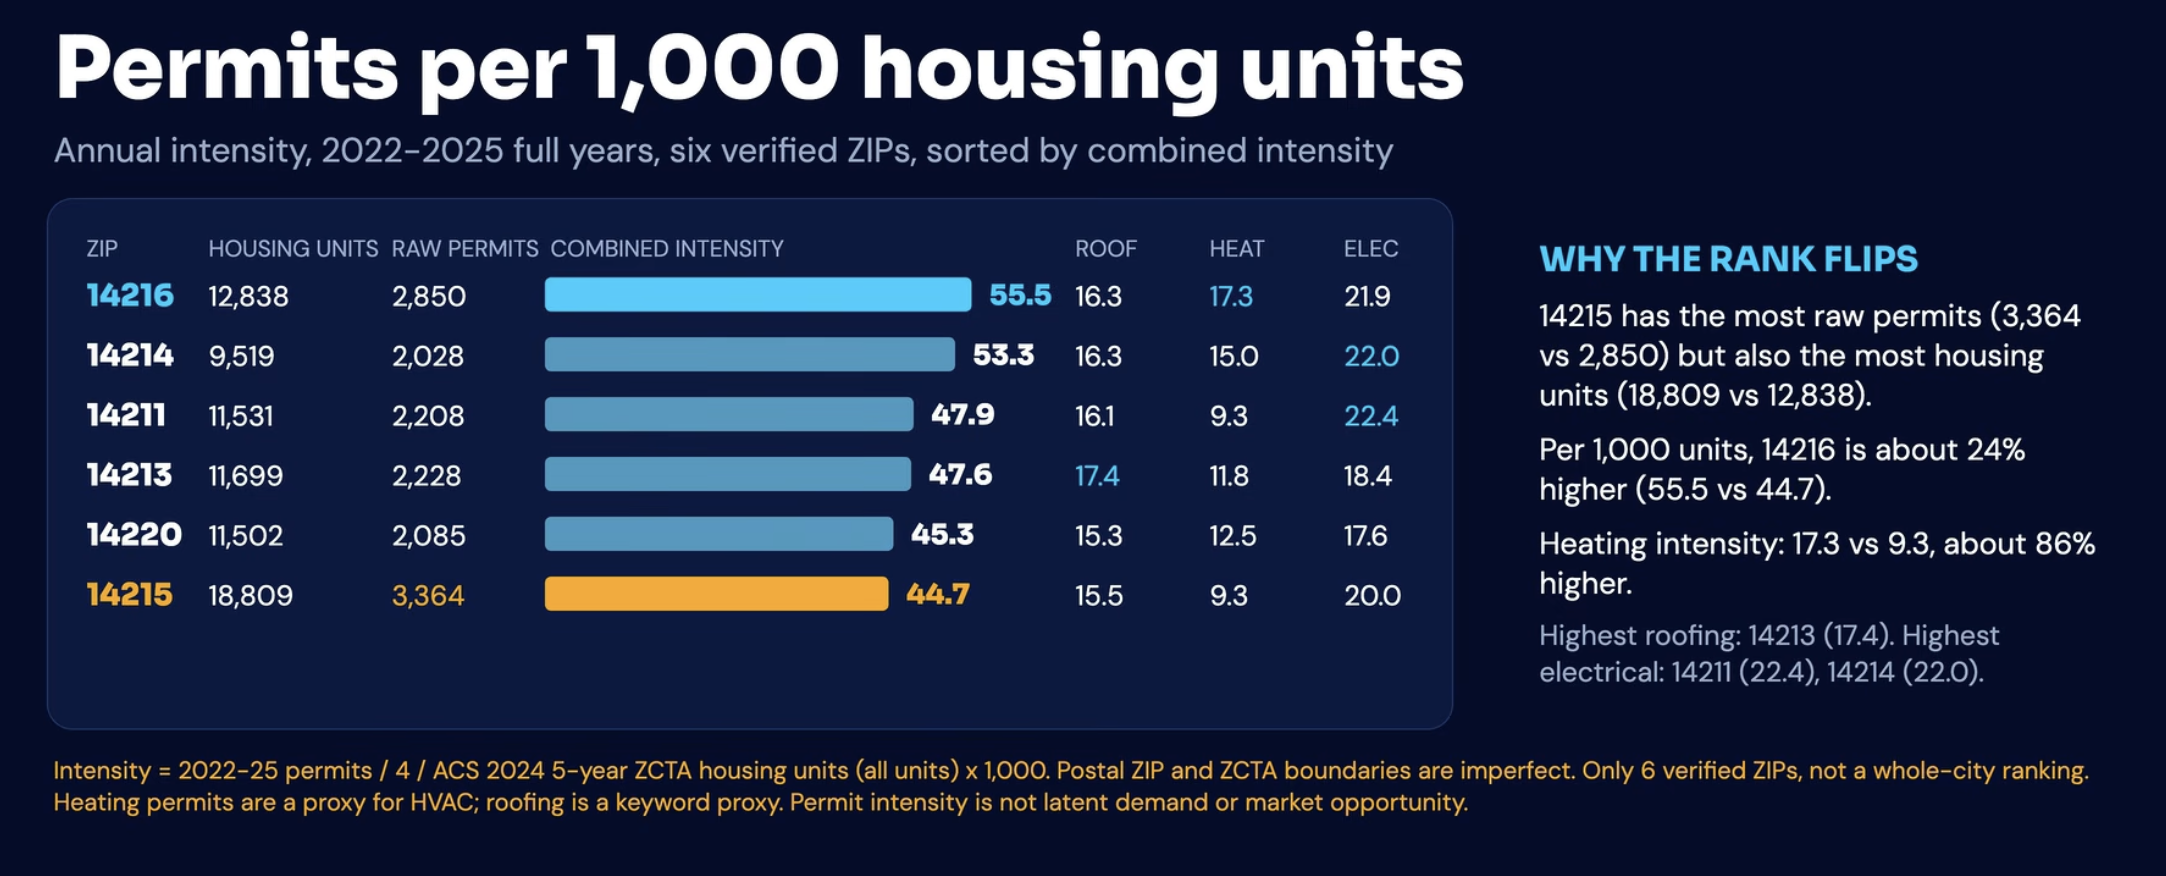
Across six selected Buffalo ZIP codes, ZIP 14215 recorded the highest combined roofing, heating, and electrical permit volume between 2022 and 2025.
ZIP 14215: 3,364 permits
ZIP 14216: 2,850 permits
Looking exclusively at total permits, 14215 appears to be the stronger market.
But what happens when we account for housing stock?
Using 2024 ACS five-year estimates, we calculated annual permit activity per 1,000 housing units.
The results flipped the ranking.
| ZIP code | Annual permits per 1,000 housing units |
|---|---|
| 14216 | 55.5 |
| 14215 | 44.7 |
ZIP 14216 demonstrated approximately 24% higher normalized permit activity than 14215.
That's a meaningful difference.
It illustrates why contractors shouldn't rely exclusively on raw permit counts when evaluating geographic markets.
A larger ZIP code may naturally generate more permits because it contains more housing units.
Normalizing the data provides another perspective on market activity.
These figures describe recorded permit intensity, not necessarily future demand or untapped opportunity. The comparison also uses Census ZIP Code Tabulation Areas, whose boundaries don't perfectly match postal ZIP codes.
Which Contractors Are Pulling Electrical Permits?
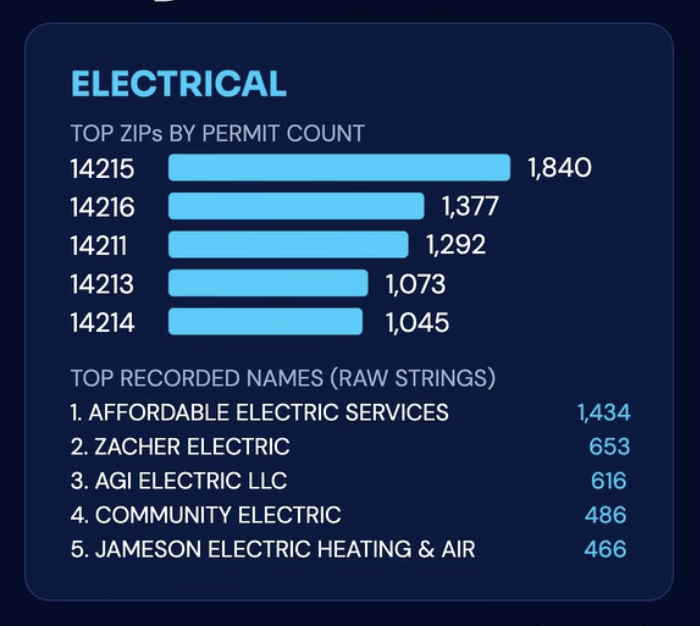
We also examined the names recorded on Buffalo's electrical permits.
Across the available dataset, the leading recorded names included:
Affordable Electric Services: 1,434 permits
Joseph Sapienza: 1,406 permits
Zacher Electric: 653 permits
The relatively small difference between the first two is noteworthy.
However, these are recorded permit-party names, not independently verified company identities. They may include individual license holders, business names, or aliases.
Permit volume also shouldn't be confused with confirmed market share, revenue, or business performance.
Still, monitoring these records over time can help contractors understand how the competitive landscape is evolving.
Better Data. Better Decisions.
The biggest takeaway from Buffalo isn't that one ZIP code or contractor is necessarily better than another.
It's that contractors need more context before making business decisions.
Permit records help reveal where work is occurring. Census data helps explain the size and characteristics of local housing markets. Historical comparisons help identify changing activity patterns.
Combined, these insights can inform decisions about marketing, territory development, competitive research, and business expansion.
That's exactly why we built ContraX.
We help contractors, suppliers, and manufacturers turn public permit data into useful market intelligence without spending hours sorting through spreadsheets.
Want to understand what's happening in your market?
Visit ContraXAnalytics.com to explore the platform.
And tell us: Which city should we analyze next?
Methodology: Buffalo permit records dated October 24, 2021–October 20, 2026. Annual comparisons use complete calendar years 2022–2025. Roofing permits were identified using description keywords; heating permits serve as an HVAC proxy. ACS comparisons use 2024 five-year housing-unit estimates for six selected ZIP/ZCTA areas. Permit activity does not independently establish market demand, revenue, or verified contractor market share.